ClimateCheck Risk Ratings
For each hazard—heat, precipitation, drought, flooding, and fire—we analyze the modeled frequency and severity of extreme events, in the past and through 2050, to create a 1-100 rating relative to our data coverage area.
We synthesize data from internationally accepted models and government agencies, informed by academic research. Our rating for each hazard is based on climate change projections through 2050. We provide the underlying details of the ratings, described below for each hazard, and compare these details for multiple emissions scenarios, representing a range of possible futures depending on how much, and how quickly, humans reduce our greenhouse gas emissions.
Extreme Heat
Greenhouse gas emissions have caused over 1.0ºC of global warming so far. In addition to raising average temperatures, this warming is increasing the frequency and intensity of heat waves.
We estimate heat risk using the number of your area’s hottest days projected for years around 2050, and the level of risk on these days.
These include days with the highest temperatures (“dry bulb temperature”) and days with the most stress on the body due to heat and humidity (“wet bulb temperature”). We look at historical conditions (1980-2005) in your area, on the hottest 2% of days per year, to define thresholds for these days.
The average number of these extreme heat risk days each year is projected to keep increasing everywhere in the contiguous U.S and Canada. This means that even areas with the lowest risk ratings are experiencing an increase in the hottest days.
Sources: LOCA statistically downscaled CMIP5 Projections for North America; MACA downscaled Global Climate Models. Resolution: 1/16º (~5km). Ratings are relative to the contiguous U.S. and Canada.
Phoenix, AZ, rated 83/100 for heat risk, is projected to go from about 7 days per year over 110ºF to about 45 days per year by 2050. Wet bulb temperatures are projected to increase from about 4 days per year over 80ºF to 21 days per year by 2050.


Extreme Precipitation
Rising temperatures increase water vapor in the atmosphere, by increasing evaporation, and because warmer air can hold more moisture. While total yearly precipitation may increase or decrease depending on region, climate models agree that the precipitation that does occur will become more severe.
We estimate precipitation risk using the number of your area’s wettest events each year projected for years around 2050, and the amount of rain in these storms.
We look at historical conditions (1980-2005) in your area, on the days with the top 1% of total precipitation in a year, to define the threshold for the wettest events, defined as surpassing this threshold over two days.
Source: LOCA statistically downscaled CMIP5 Projections for North America. Resolution: 1/16º (~5km). Ratings are relative to the contiguous U.S.
Trenton, NJ, rated 95/100 for precipitation risk, is projected to go from about 44.9” of rainfall annually to about 48.8” by 2050. All of this increase is projected to occur in events with the most extreme rainfall (an extreme precipitation event for Trenton is a 48-hour rainfall total above 1”).


Wildfire
Climate change can create more severe wildfires by drying out vegetation, increasing the frequency of fire weather, and making fire seasons longer.
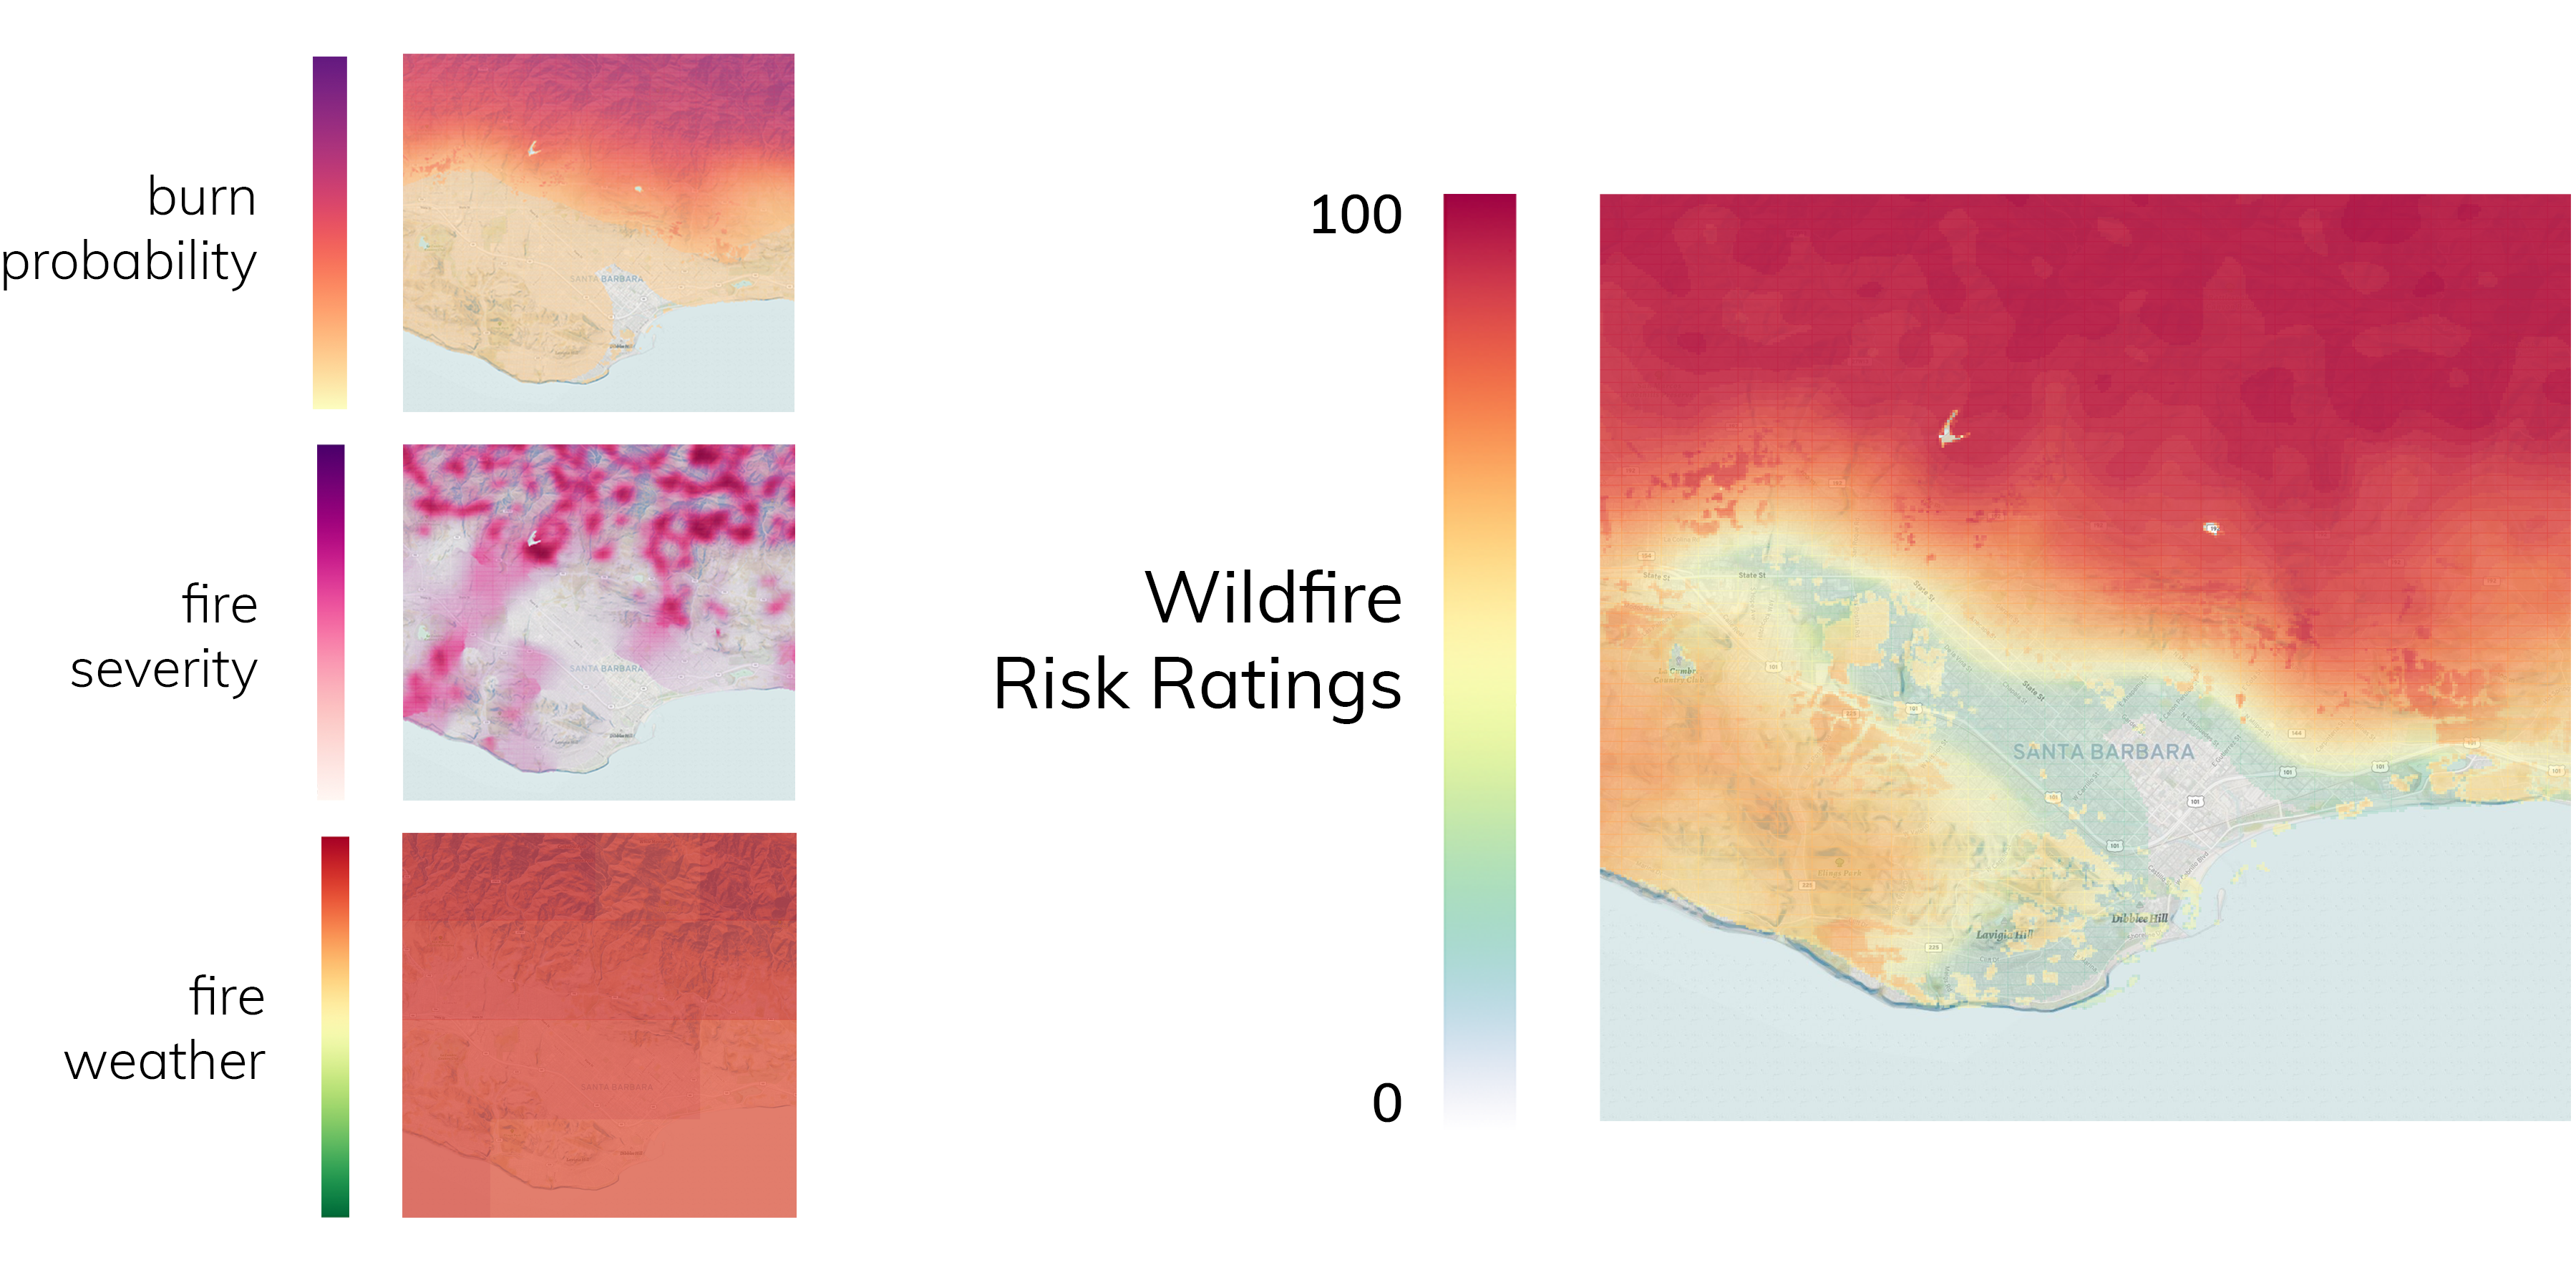
Our fire risk rating is based on a specific location’s probability of burning, the likely severity of a fire there, and the projected risk on days with the worst conditions for fire spread through 2050.
Fire severity, based on likely flame heights if a fire were to occur, and annual burn probability are results from many simulations of fire behavior, based on land cover and conditions around 2020.
The fire weather index (FWI) incorporates daily temperature, relative humidity, precipitation, and wind speed to measure the risk of fire spread. We consider the severity of the FWI on the worst days in the past (1981-2005) as well as the number of these most severe fire weather days projected for 2050 to determine the fire weather component of the risk rating. Modeled historical and projected FWI data are based on 10-year averages from an ensemble of 20 downscaled global climate models.
Sources: U.S. Forest Service Research Data Archive, Wildfire Risk to Communities; MACA downscaled global climate models. Resolution: 30m. Ratings are relative to the contiguous U.S.
This region around Santa Barbara, CA has fire risk ratings ranging from 0, in the most densely developed areas, to around 40 in the wildland-urban interface, and up to 97 in the wildland areas.Burn probability ranges from about 0% in the urban center all the way up to a 45% chance of burning in a 30-year window for the wildland areas. Fires in this region have up to an 87% chance of flame heights above 8 feet. This region experiences extreme risk conditions on the highest FWI days, and is projected to have 4-5 more of these days per year by 2050.

Drought
Droughts are periods of time when moisture is significantly below average. Types of drought include precipitation deficits, soil moisture deficit and crop failure, ecological drought affecting trees, and hydrological drought with socioeconomic impacts such as water shortages. Climate change contributes to droughts through climatic drivers such as decreasing snowpack and increased evaporation.
We estimate U.S. drought risk using models of water supply stress, which estimates how much of the available water in a location is expected to be used by human activity. Water stress, based on annual flow (supply) and withdrawal (demand), is delineated for sub-basins, or HUC8 hydrologic units (there are about 2,000 of these in the U.S.). The average baseline water stress (2011-2020) and the projected change in water stress both contribute to the drought risk rating.
Source: Duan, K. et al (2019). Understanding the role of regional water connectivity in mitigating climate change impacts on surface water supply stress in the United States. Journal of Hydrology. Ratings are relative to the contiguous U.S.
The Cottonwood-Tijuana sub-basin in California, rated extreme for drought risk, is projected to have decreased average flow and increased demand, with typical water stress increasing from about 71% (2011-2020) to about 88% (2045-2054). Water stress over about 40% is considered high.


Flooding
Climate change can increase the severity of floods by increasing the severity of precipitation, runoff due to dry soil that absorbs moisture poorly, and the likelihood of rapid snowpack melt. Other human factors such as constrained river flow, the addition of impermeable surfaces like pavement, and deforestation also contribute to flooding risks.
Climate change is also causing sea level rise due to melting ice sheets and thermal expansion of warmer ocean water, increasing both the depths of storm surges and coastal inundation during high tides.
Our flood risk ratings combine information about the probability and depth of four types of floods: coastal high-tide flooding, storm surge, fluvial (riverine), and pluvial (surface) flooding.
Coastal Flooding
Coastal flooding includes risks from high tides and storm surges, subject to sea level rise. High-tide flood risk is based on the number of days per year projected to have inundation, based on elevation and observed and projected data for local flood gauges. Storm surge is the additional water movement above tides caused by high winds. We estimate this risk using the “maximum envelope of water” outputs from storm surge flood modeling and the historical frequency and intensity of hurricanes.
Inland Flooding
Flooding risks away from the coast include fluvial flooding, when a river, lake, or other body of water overflows, and pluvial flooding, which is surface flooding due to intense rain or runoff. We assess fluvial flood risk using a random forest model that extends FEMA flood risk zones across the entire U.S. and computes flooding depths. We model pluvial flood risk using the projected change in 6-hour rainfall extremes, elevation, land cover and soil characteristics to project the extent, probability, and depth of potential surface flooding.
Sources: LOCA Statistically Downscaled CMIP5 Projections for North America; NOAA intensity-duration-frequency curves; USDA Soil Survey Geographic Database (SSURGO); 2019 National Land Cover Database (NLCD); CADDIES WCA2D surface flood model; FEMA National Flood Hazard Layer ; Woznicki SA, Baynes J, Panlasigui S, Mehaffey M, Neale A (2019). Development of a spatially complete floodplain map of the conterminous United States using random forest. Sci Total Environ.; NOAA SLOSH model (Sea, Lake and Overland Surges from Hurricanes); National Hurricane Center (NHC) historical hurricane track data; NOAA tide gauges & sea level rise data; NOAA high tide flooding projections. Resolution: up to 10x10m grid.
The area around Miami, FL contains regions with storm surge flooding chances ranging from 26% to almost 100% over a 30-year period. Potential flood depths for areas at risk range from 1 foot to over 6 feet.

