Top Climate Change Risks: Heat, Precipitation, Fire
Use this page to learn how climate change is affecting people in South Carolina.
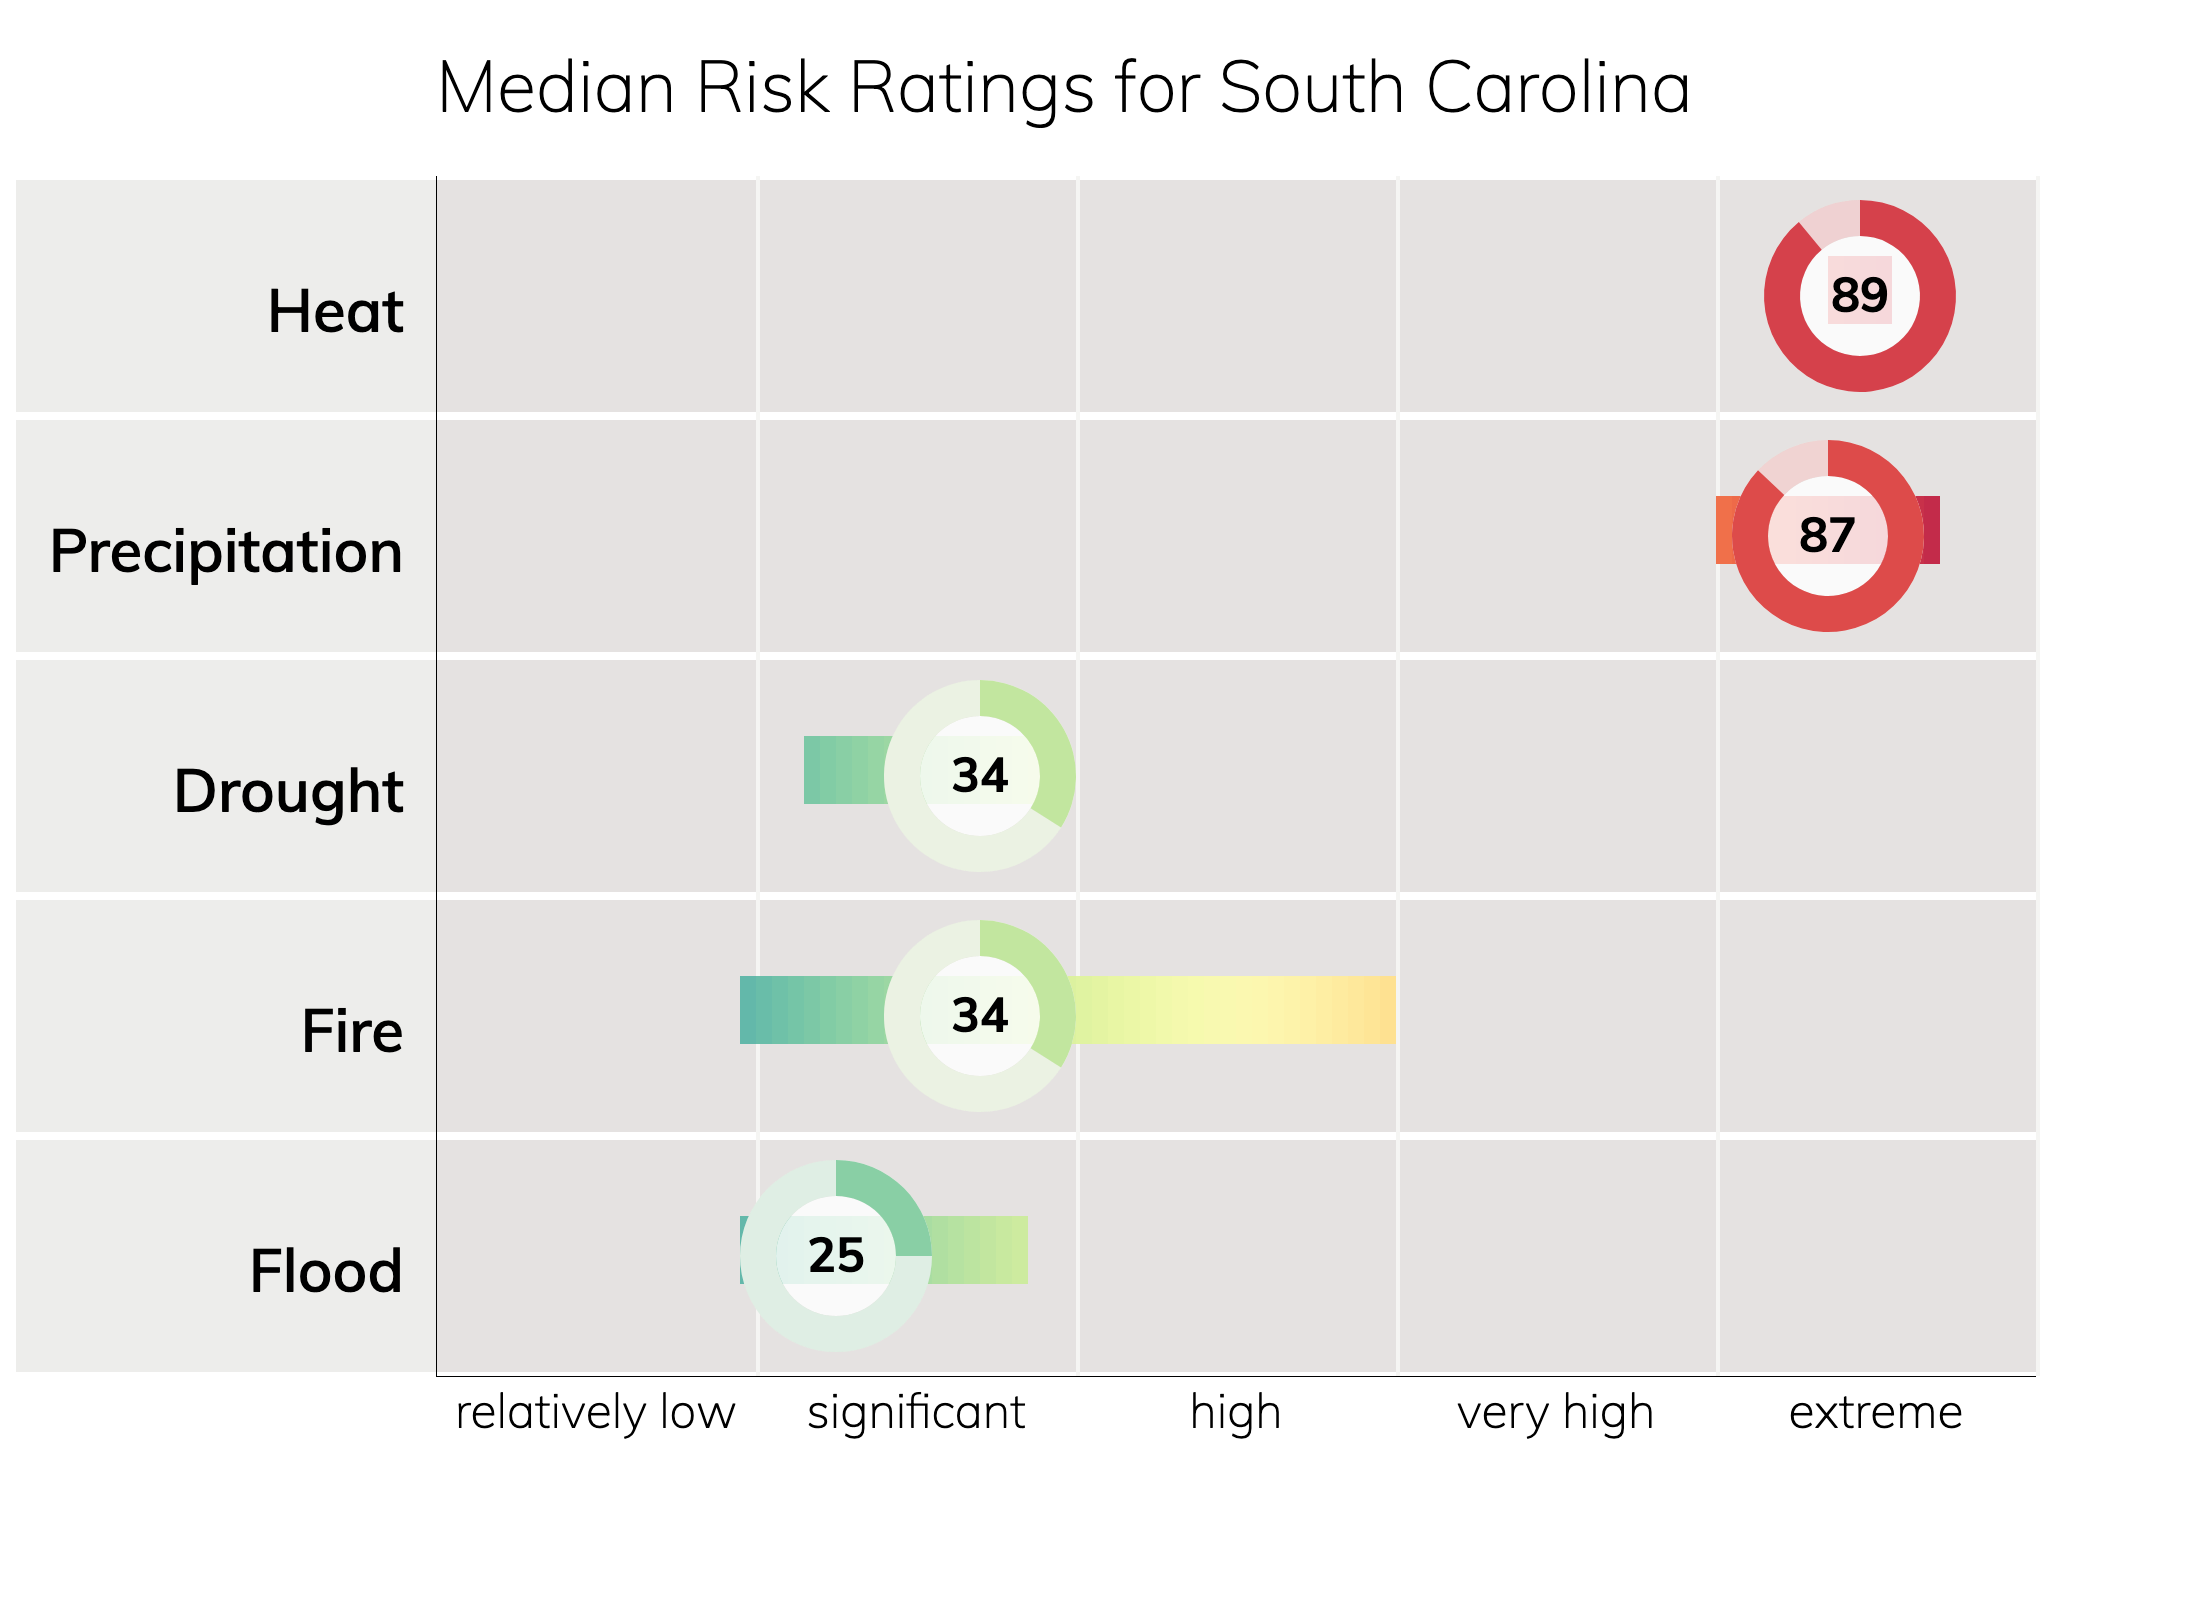
Climate Change Risk Ratings for South Carolina
People in South Carolina will experience especially increased risks from heat, precipitation, and fire due to climate change over the next 30 years. These risks, through 2050 and beyond, may change depending on how much we reduce emissions in the near future.

Get an Instant Risk Assessment
Climate Risks for Cities in South Carolina
Of these top cities in South Carolina, the city with the highest overall risk is Columbia. The city with the lowest overall risk is Hilton Head Island.
- For heat, Hilton Head Island has the lowest risk and Aiken has the highest risk.
- For precipitation, Rock Hill has the lowest risk and Greenville has the highest risk.
- For drought, Florence has the lowest risk and Summerville has the highest risk.
- For fire, Greenville has the lowest risk and Hilton Head Island has the highest risk.
- For flood, Florence has the lowest risk and Hilton Head Island has the highest risk.


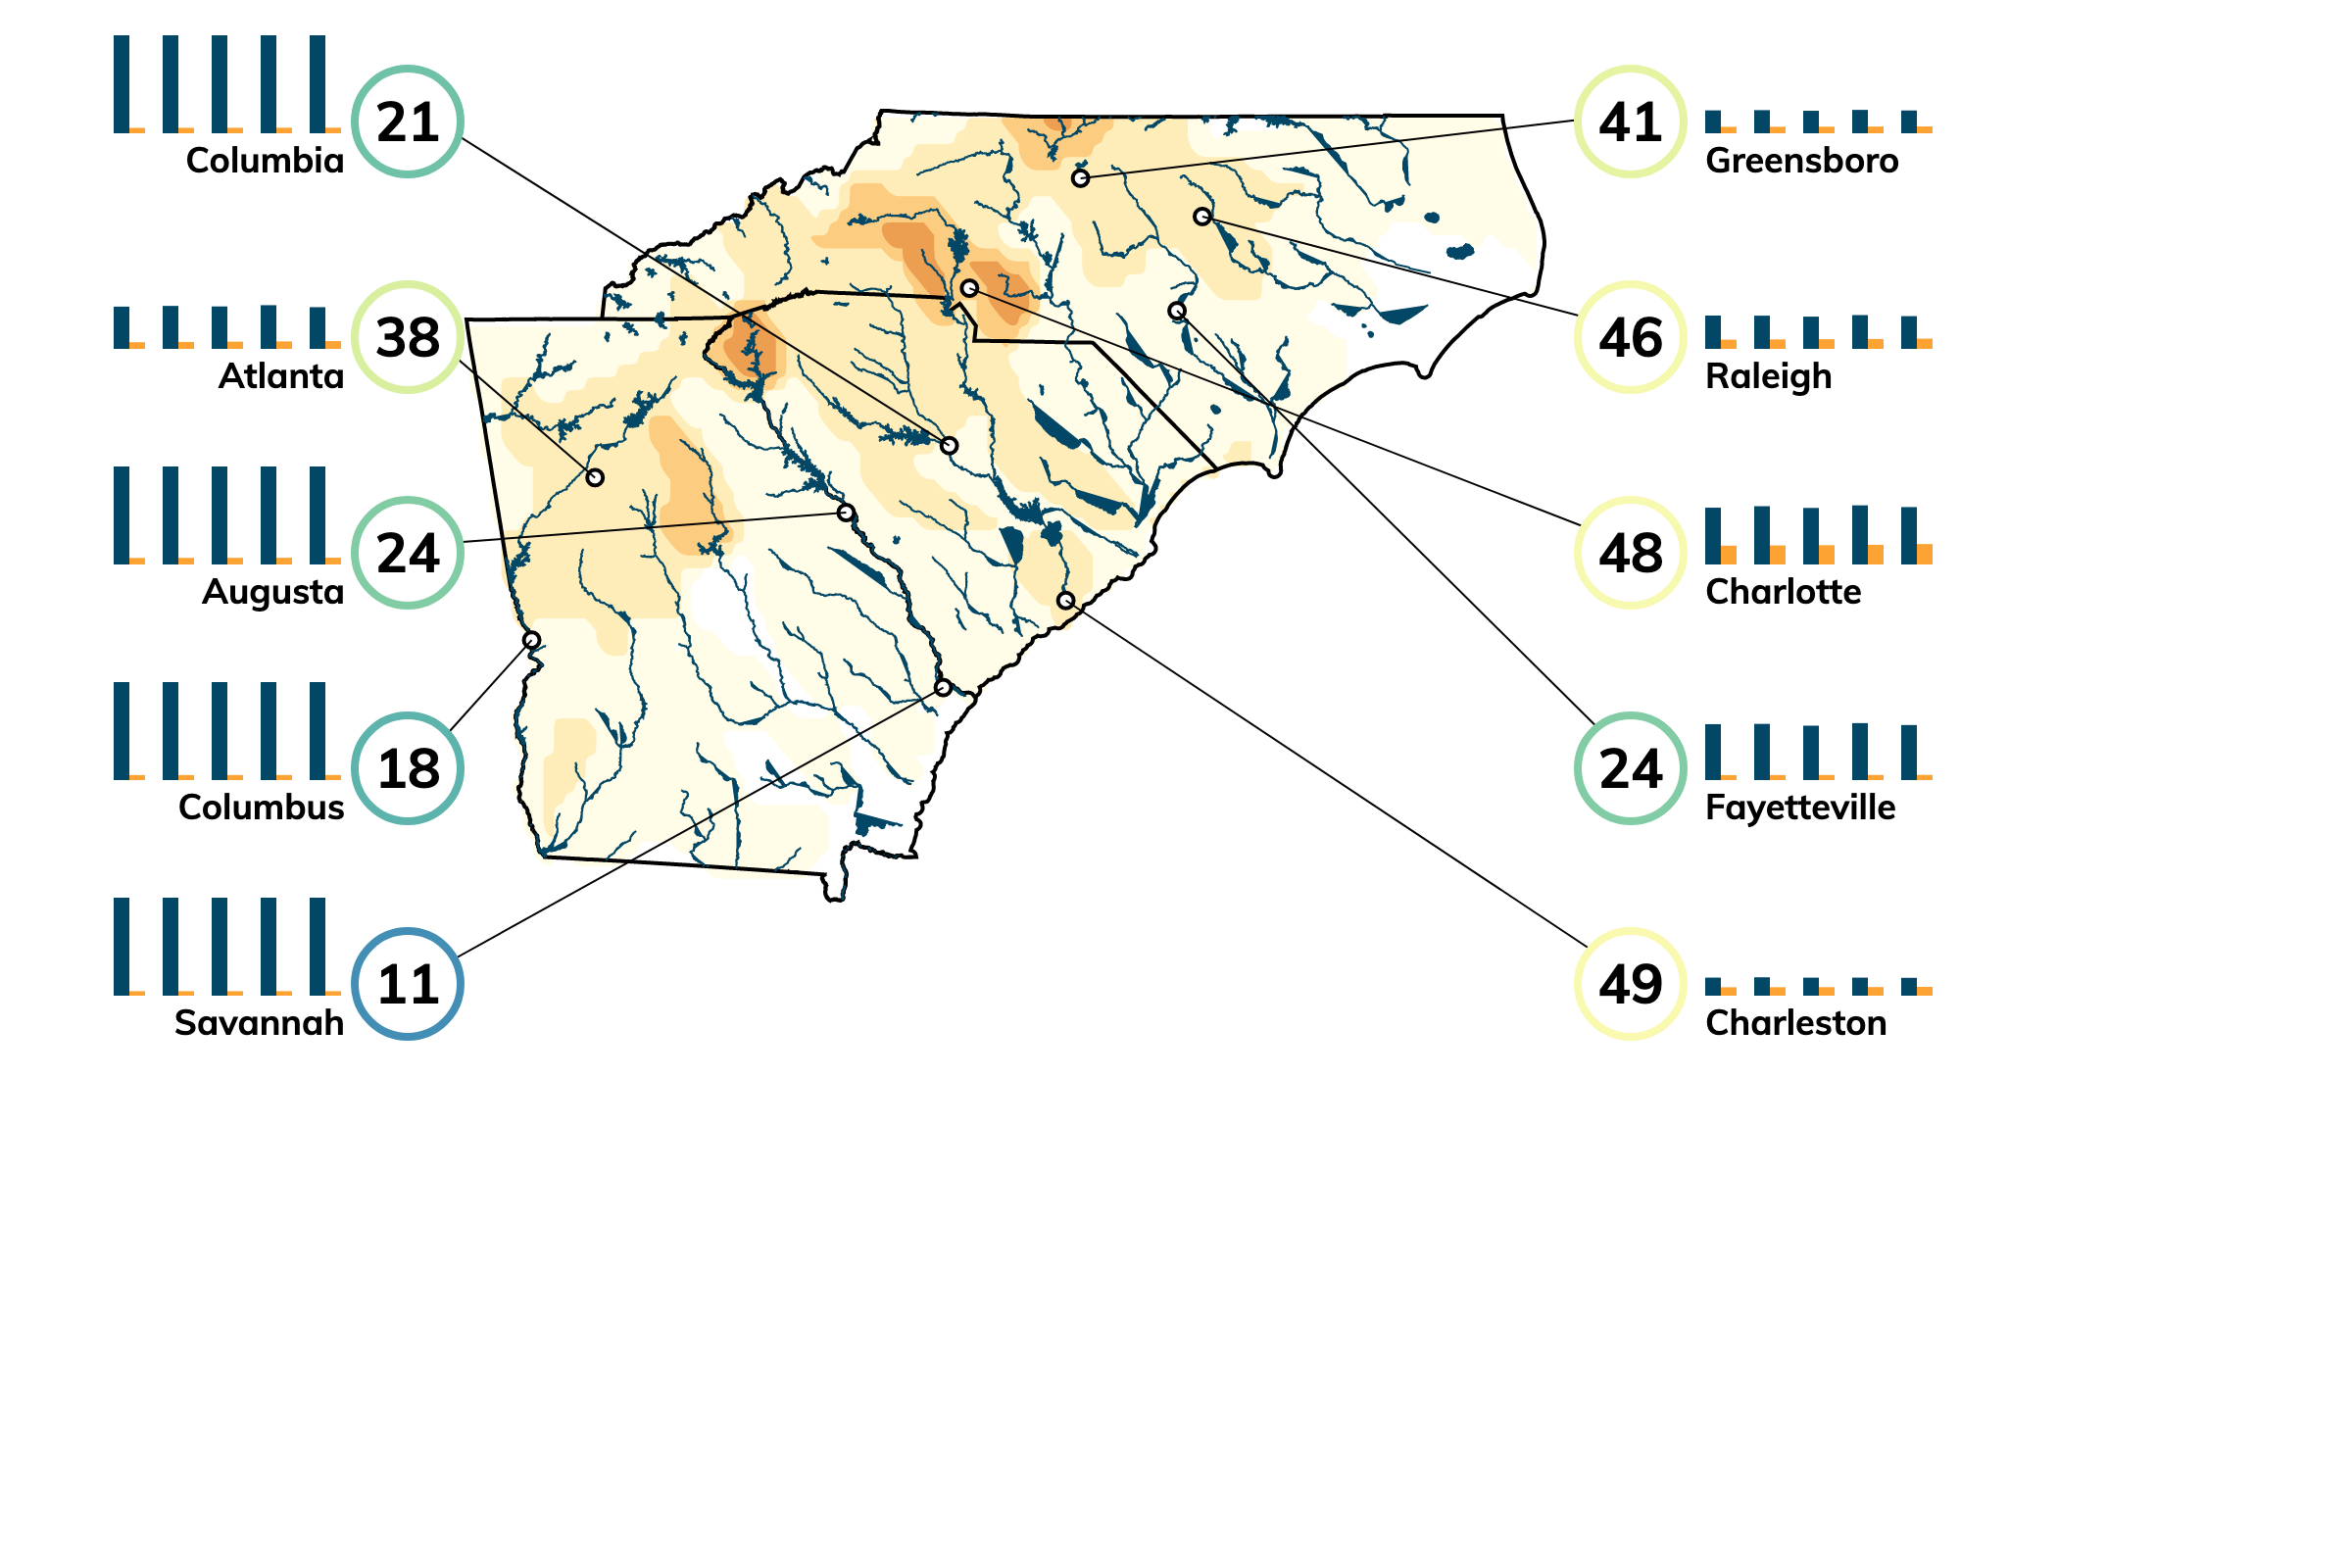
Comparing South Carolina and Other States
Among the lower 48 states, South Carolina's highest ranking is #8 for heat risk.
Louisiana and Mississippi rank highest for heat risk California and Oregon rank lowest for heat risk


Heat Risk in South Carolina with Climate Change
An extremely hot day in South Carolina depends on your location: 99ºF is extremely hot for Columbia, while 94ºF is considered extremely hot for Charleston. This is based on historical maximum temperatures on the top 2% of days in an average year.

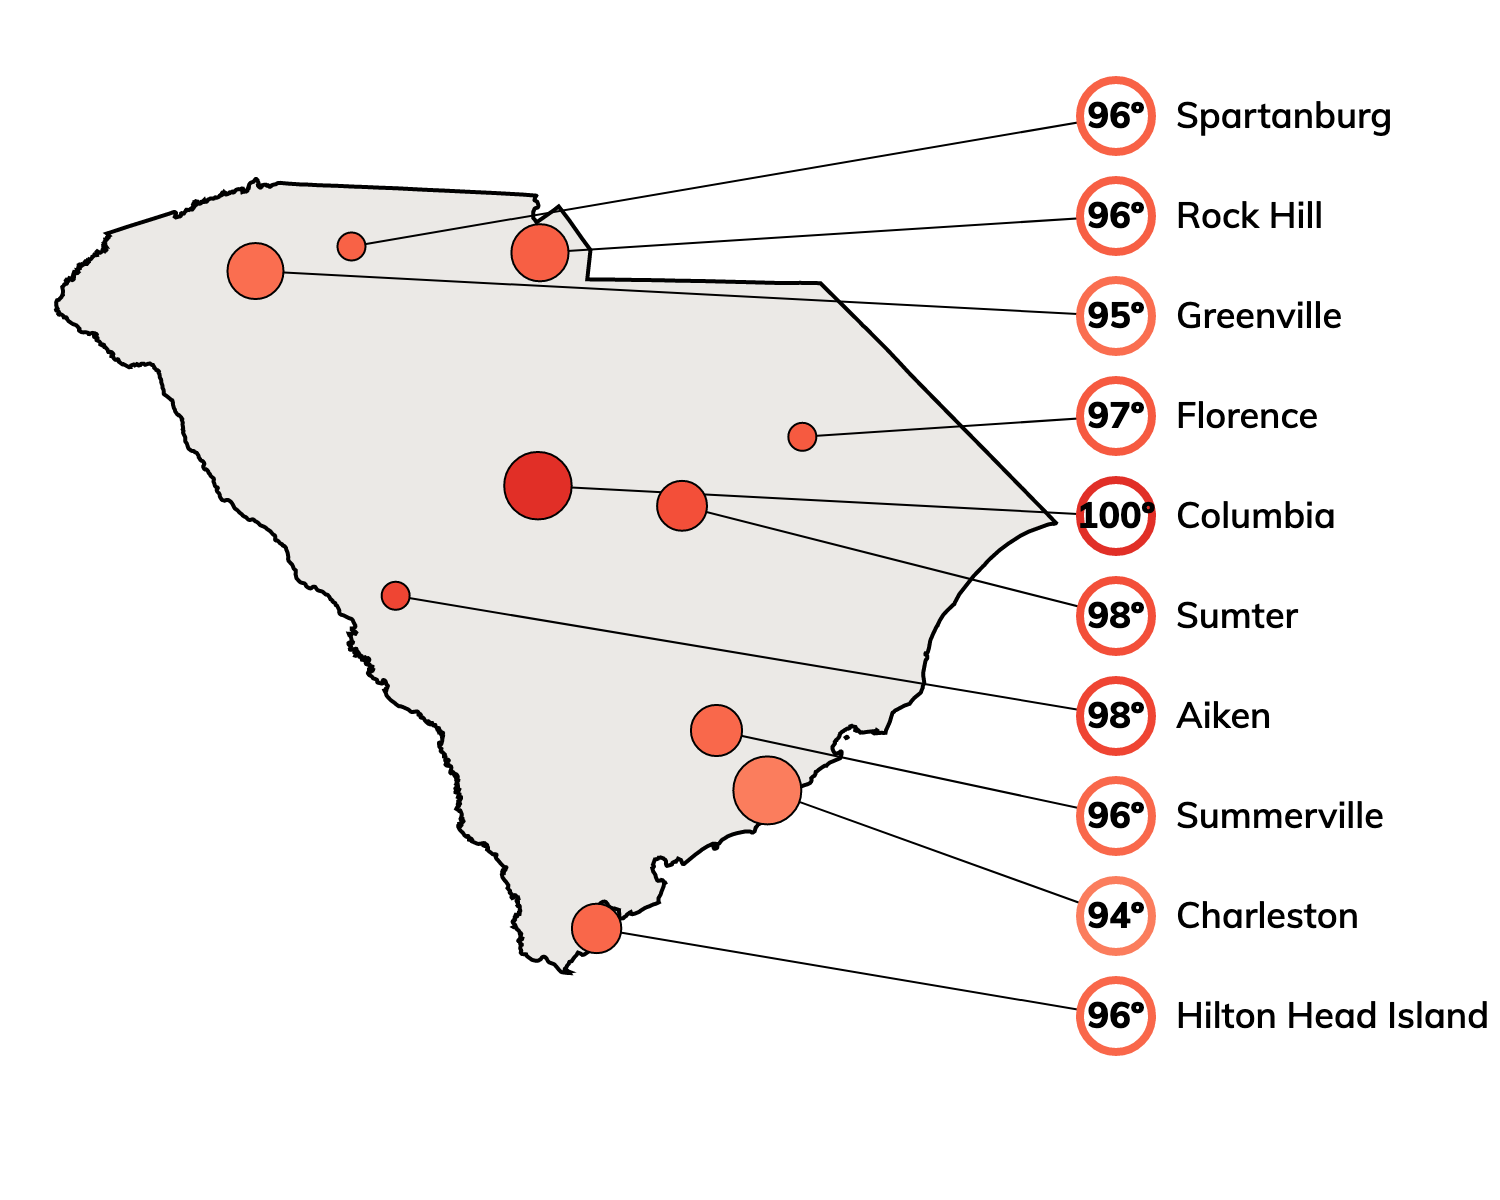
The frequency of very hot days is increasing. On average, someone in South Carolina will experience about 41 extremely hot days in 2050.

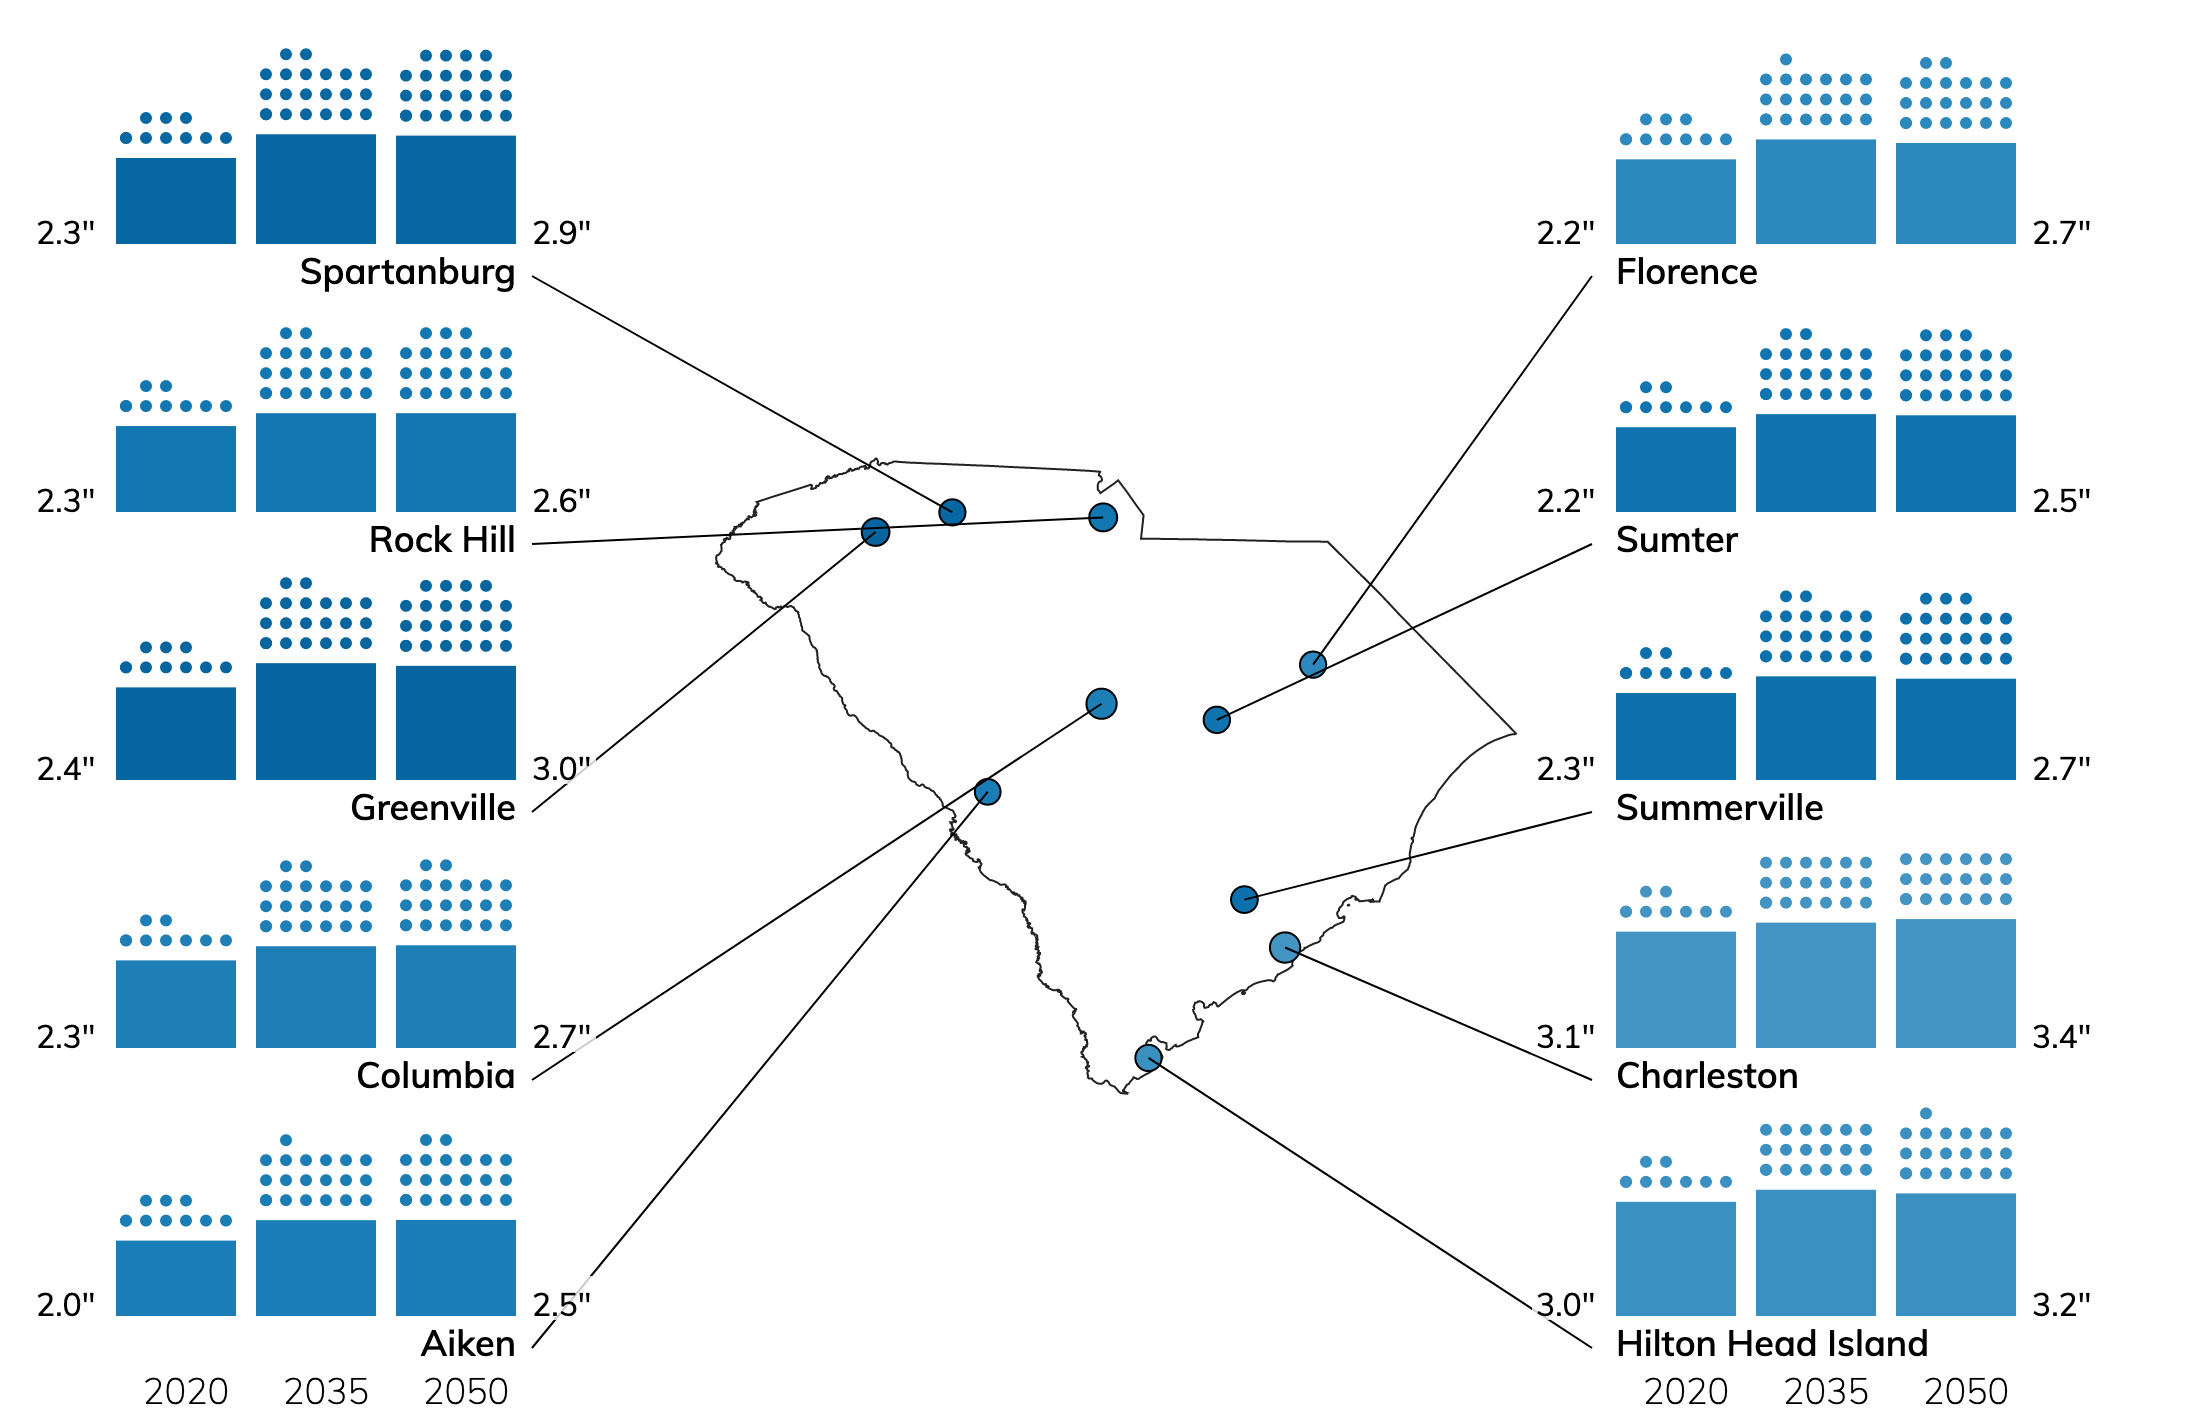
Precipitation Risk in South Carolina with Climate Change
To measure precipitation risk, we look at the amount of precipitation that falls in 48-hour periods exceeding a location-specific threshold, and how many times this happens per year. A precipitation threshold is based on the top 1% of rainiest days per year for a location.

Drought Risk in South Carolina with Climate Change
Drought risk is based on water stress, which is a projection of how much of the water supply will be taken up by human demand.

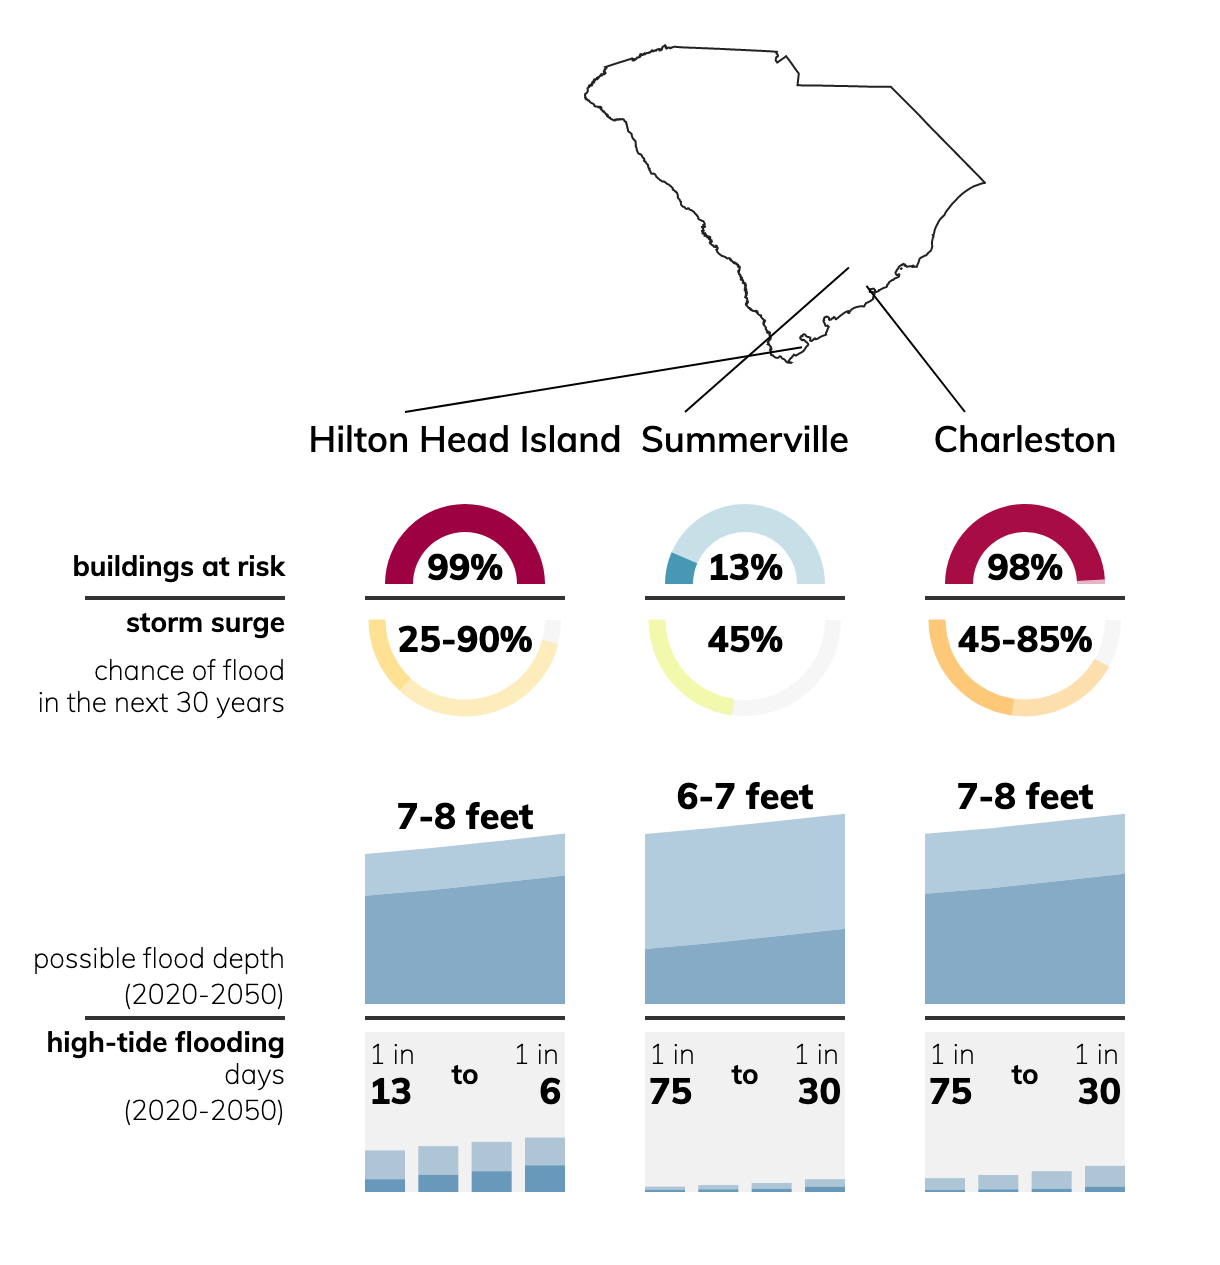
Flood Risk in South Carolina with Climate Change
Coastal flood hazards include storm surge, when strong winds push water to shore, and rising sea levels due to climate change. The rate of sea level rise varies along the coast. Rising seas contribute to greater instances and spread of high-tide flooding, when high tides inundate land, and greater potential storm surge depths.

How can we prevent climate change and protect our homes and communities?
Mitigating climate change—by eliminating our emissions into the atmosphere and reducing our strain on the environment—and adapting to our changing planet are both vital to our well-being.
Understand Risks
Check your address and get a free report describing risks to your property and in your area.
Protect Homes and Communities
Check our free report for tips on protecting your home from hazards.
Find Balance