Top Climate Change Risks: Precipitation, Heat, Fire
Use this page to learn how climate change is affecting people in Washington.
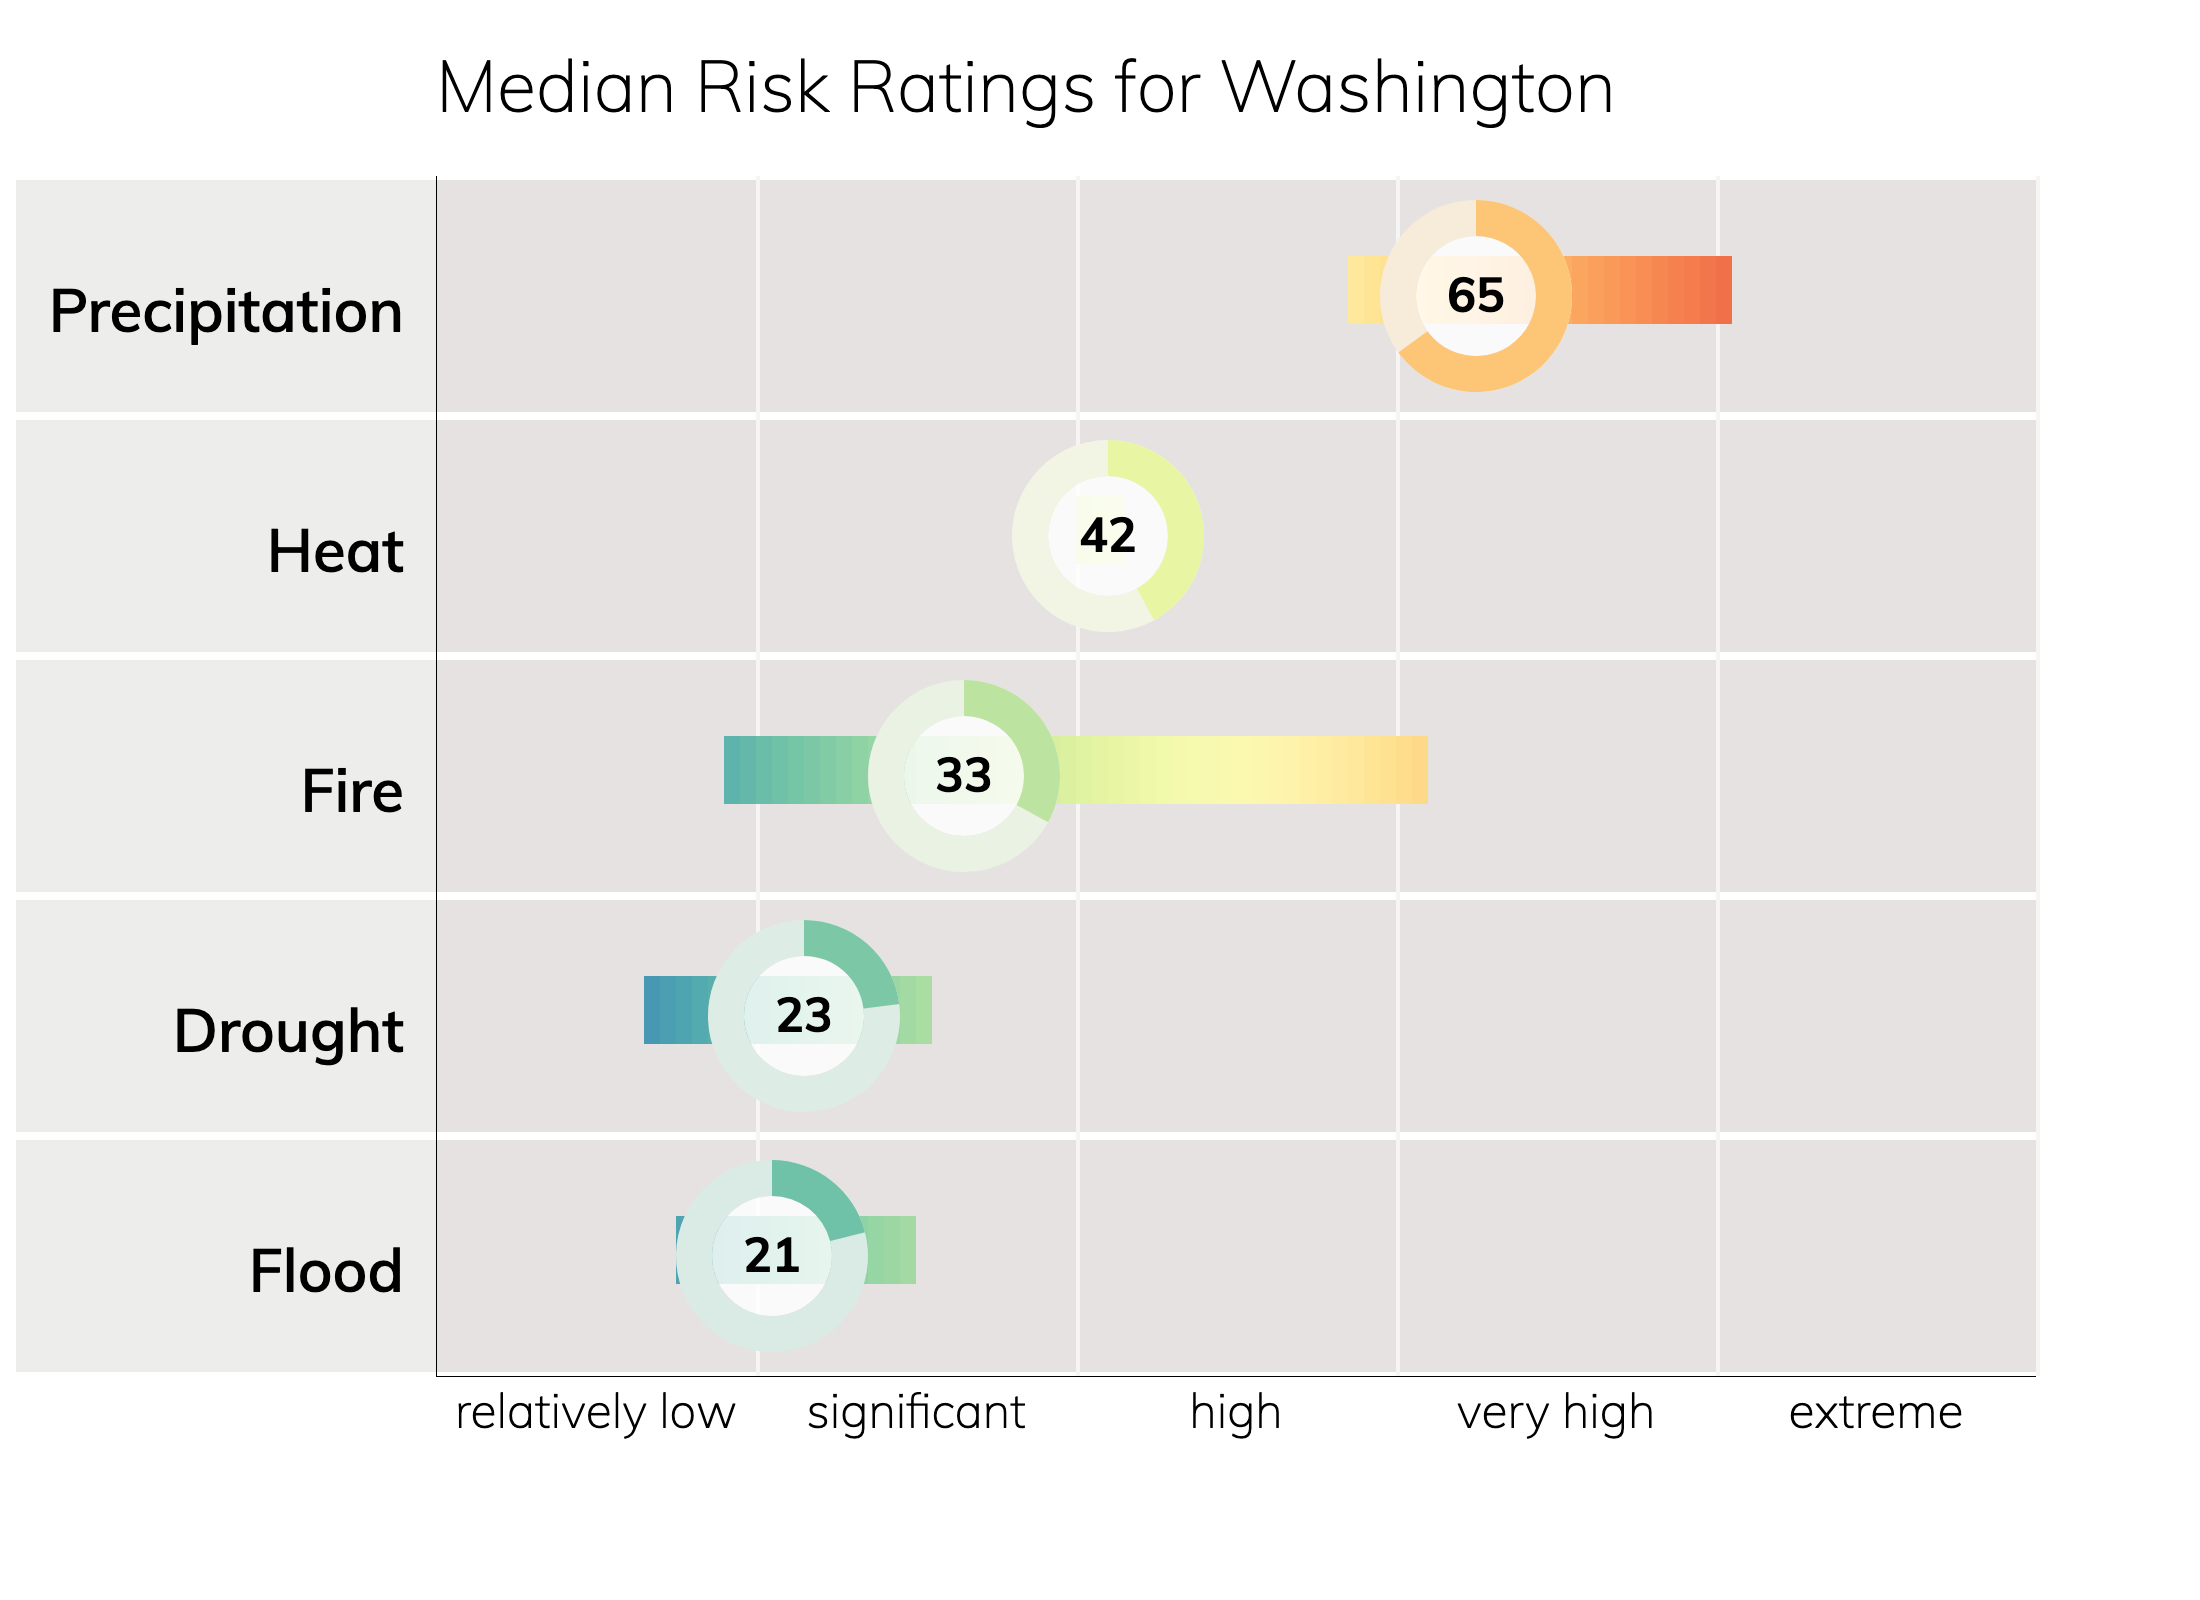
Climate Change Risk Ratings for Washington
People in Washington will experience especially increased risks from precipitation, heat, and fire due to climate change over the next 30 years. These risks, through 2050 and beyond, may change depending on how much we reduce emissions in the near future.

Get an Instant Risk Assessment
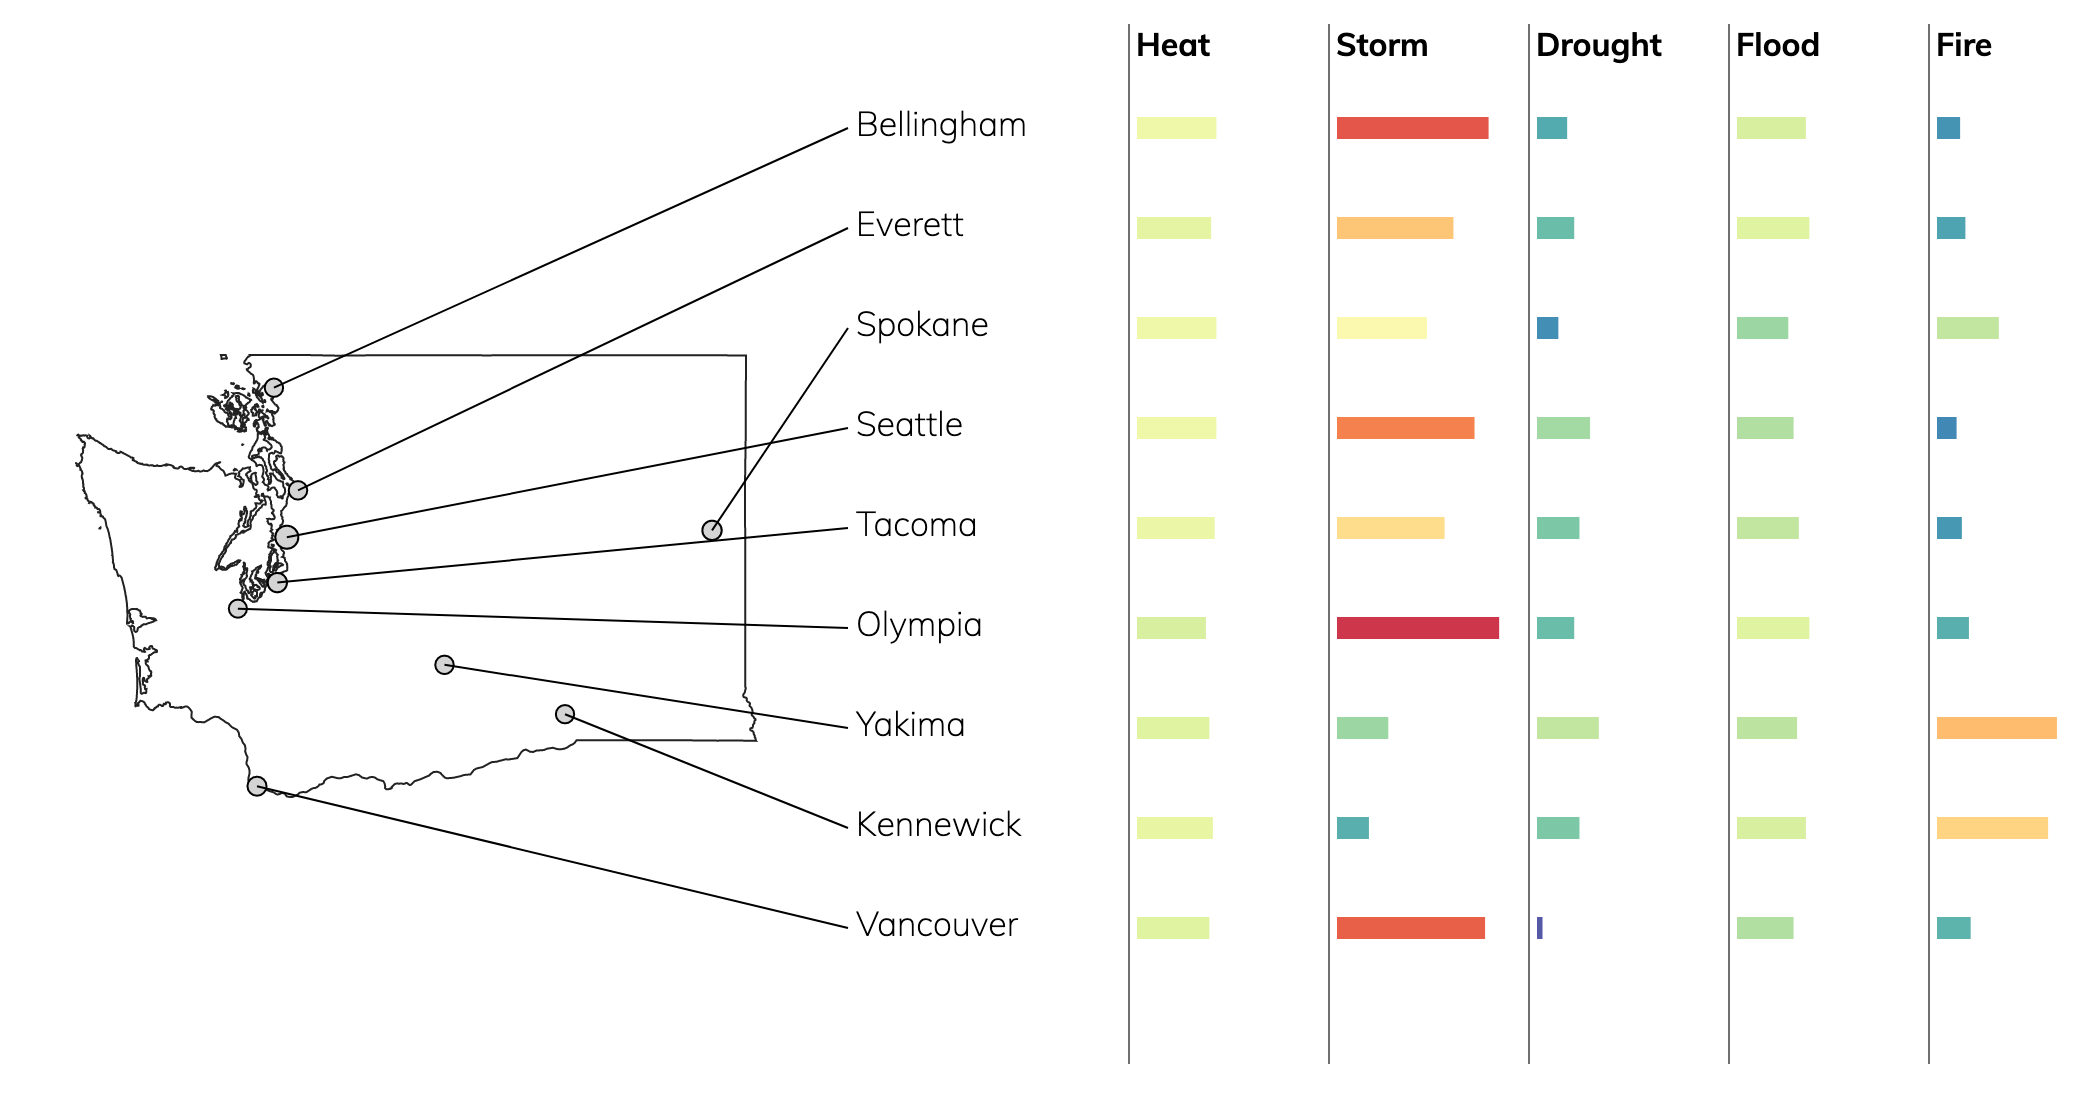
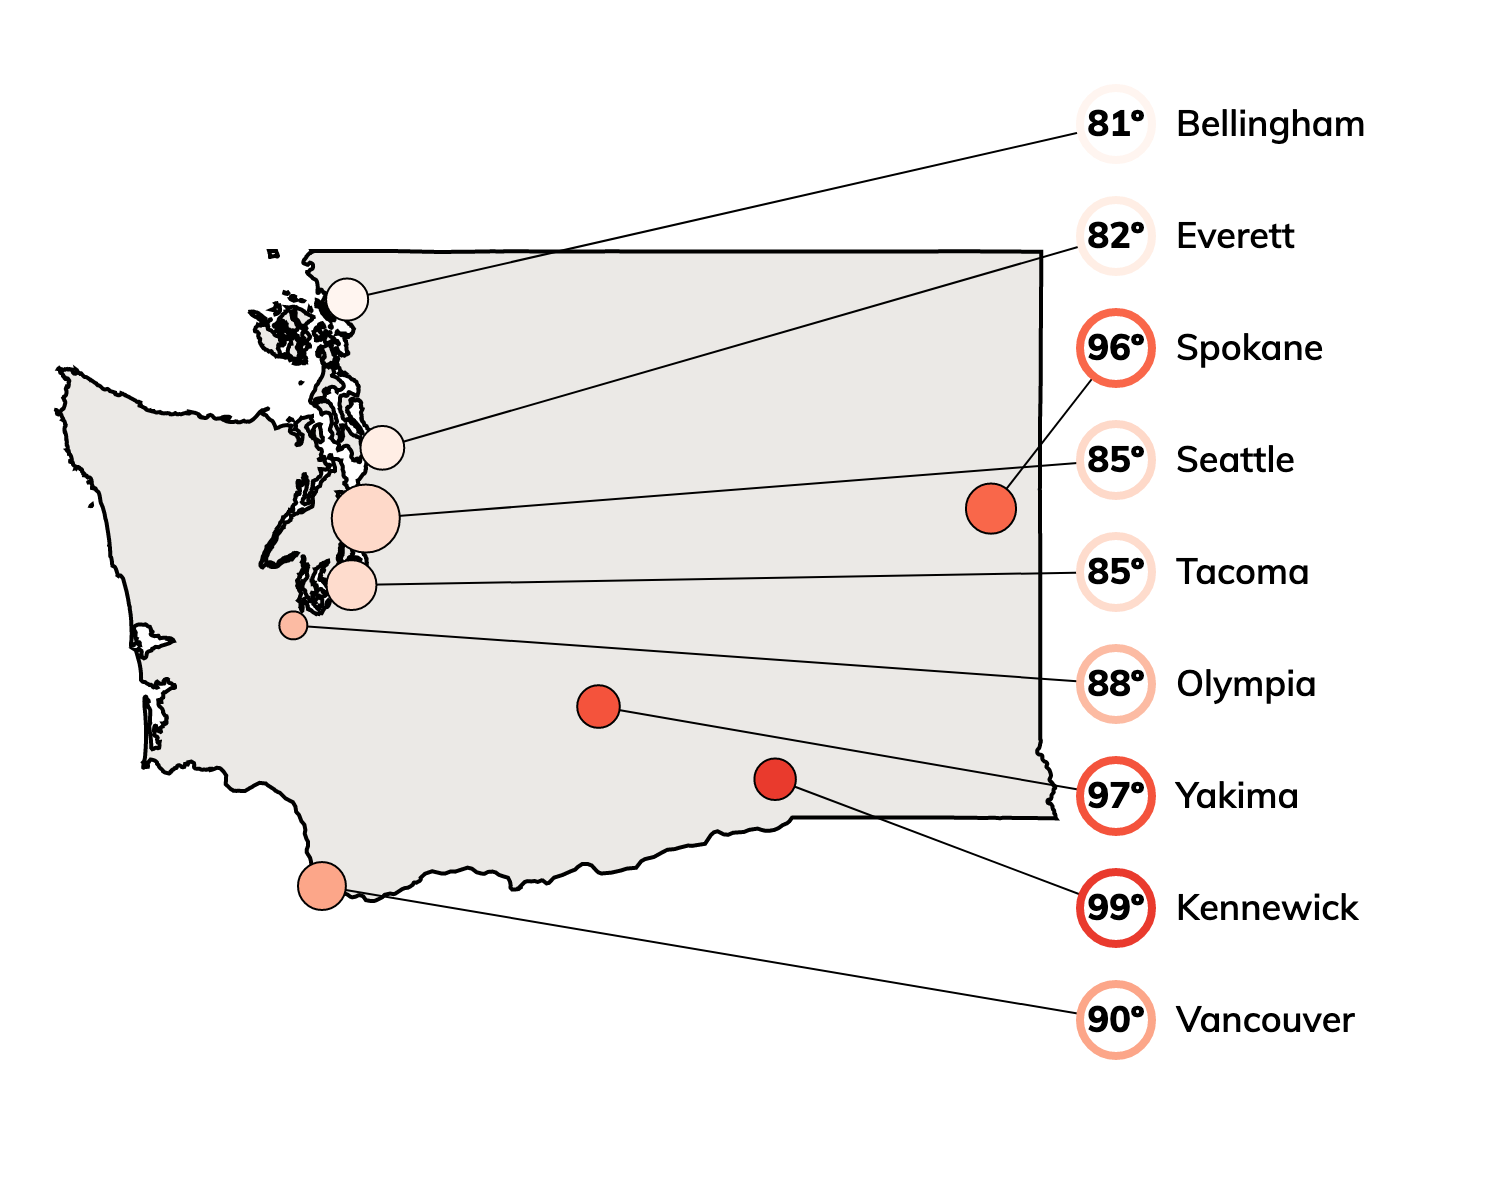
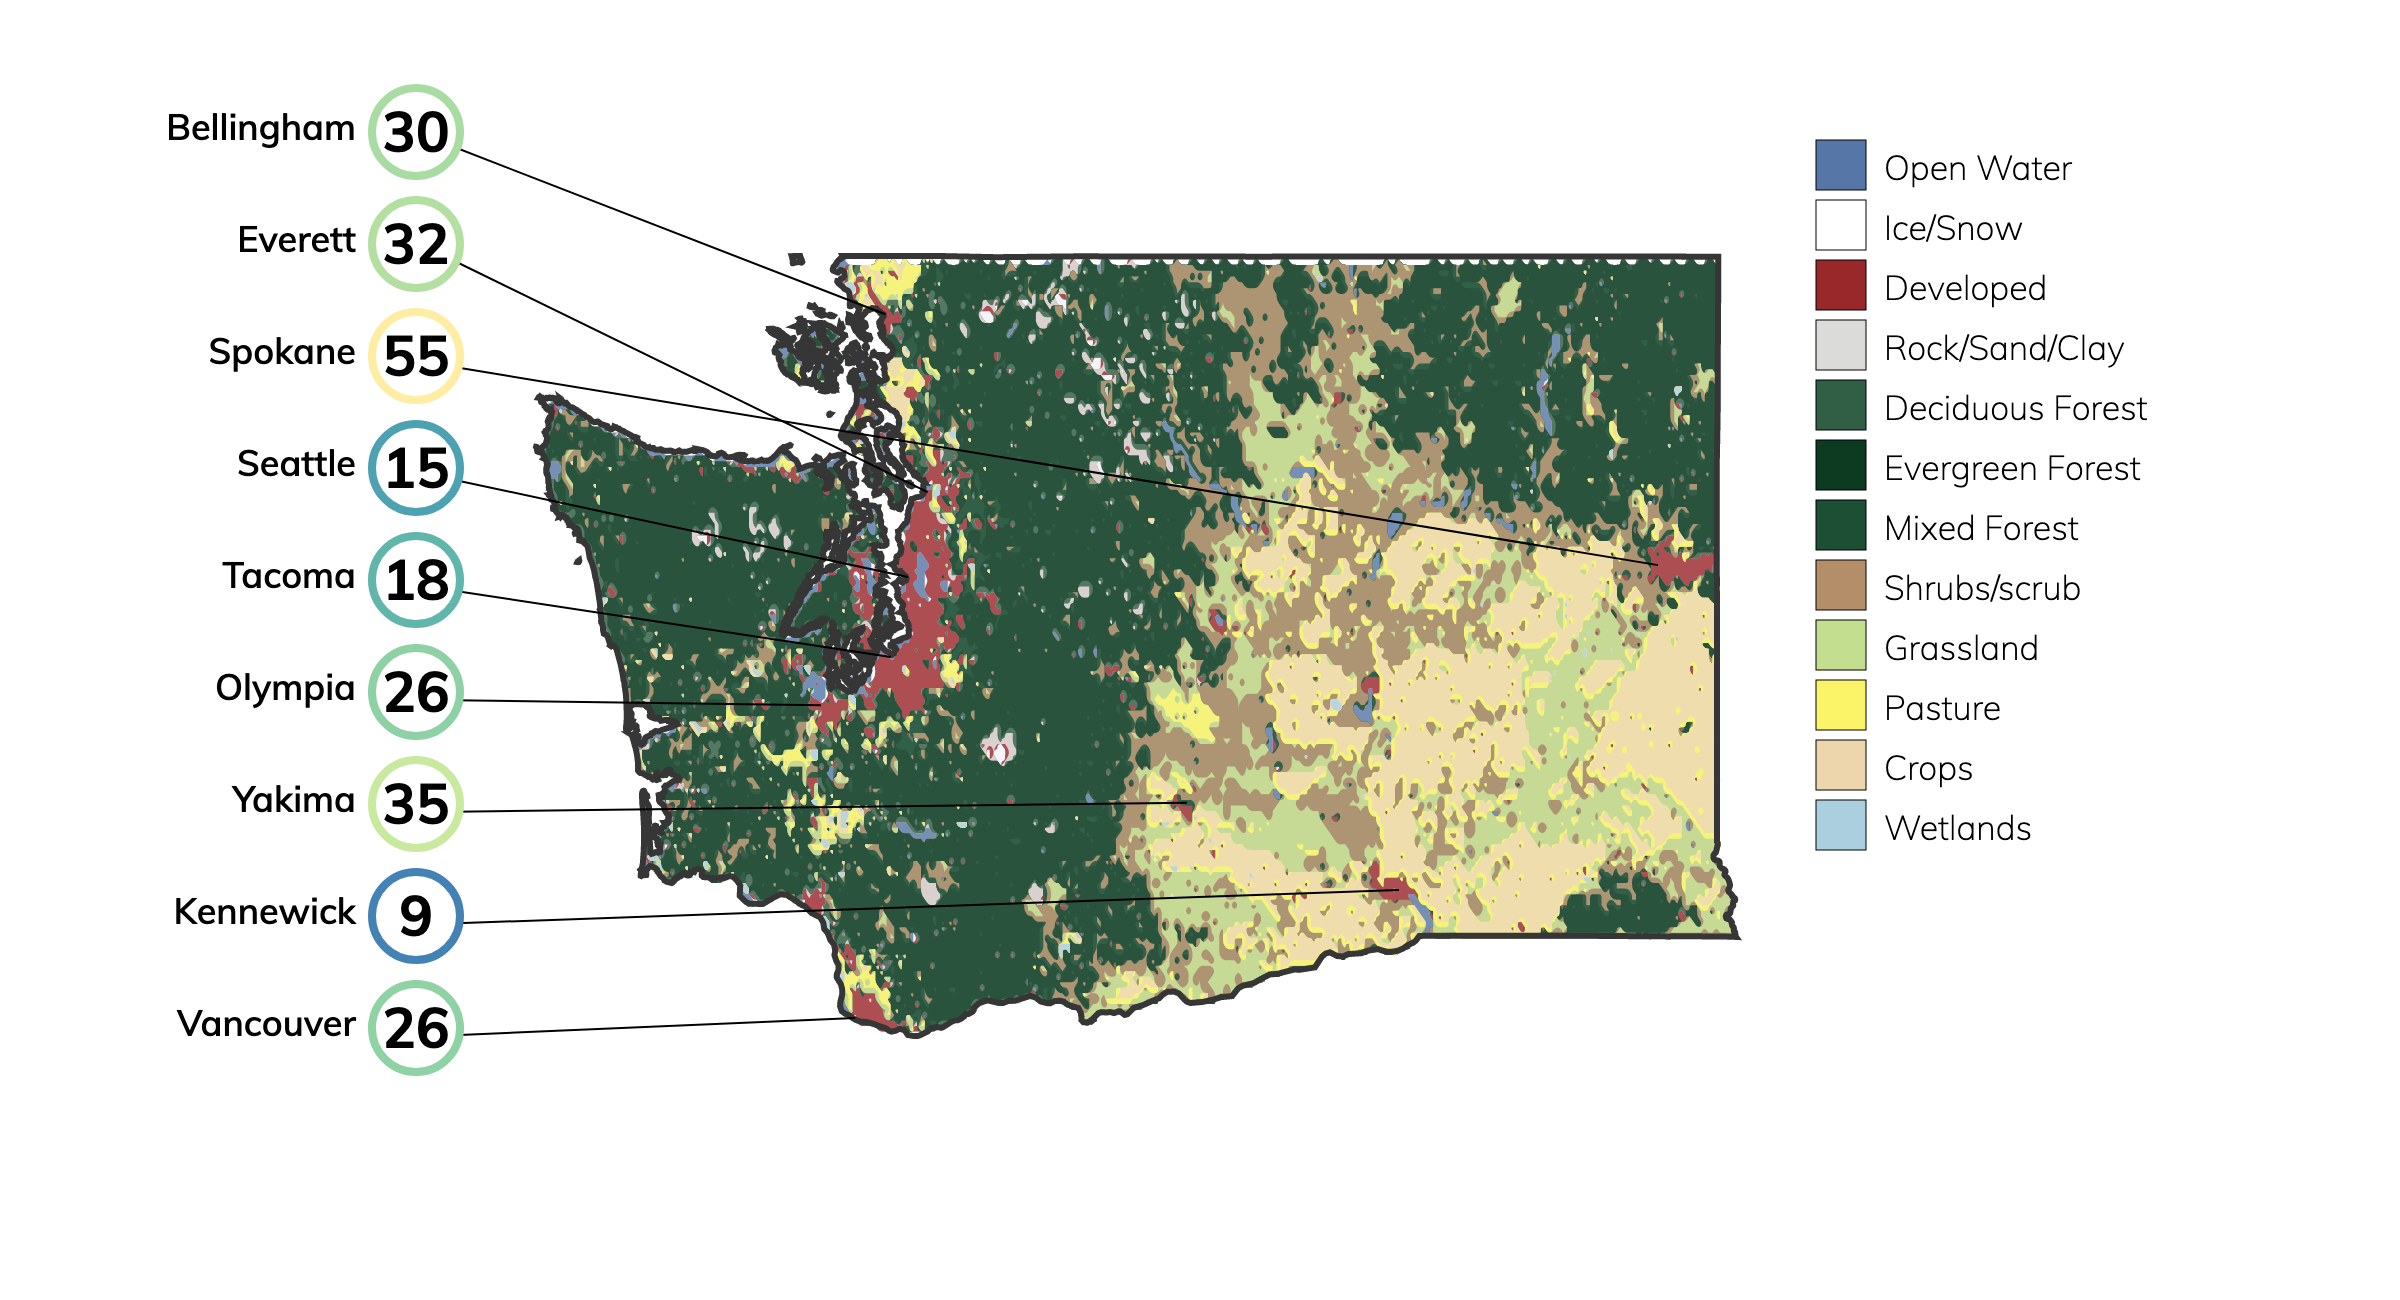
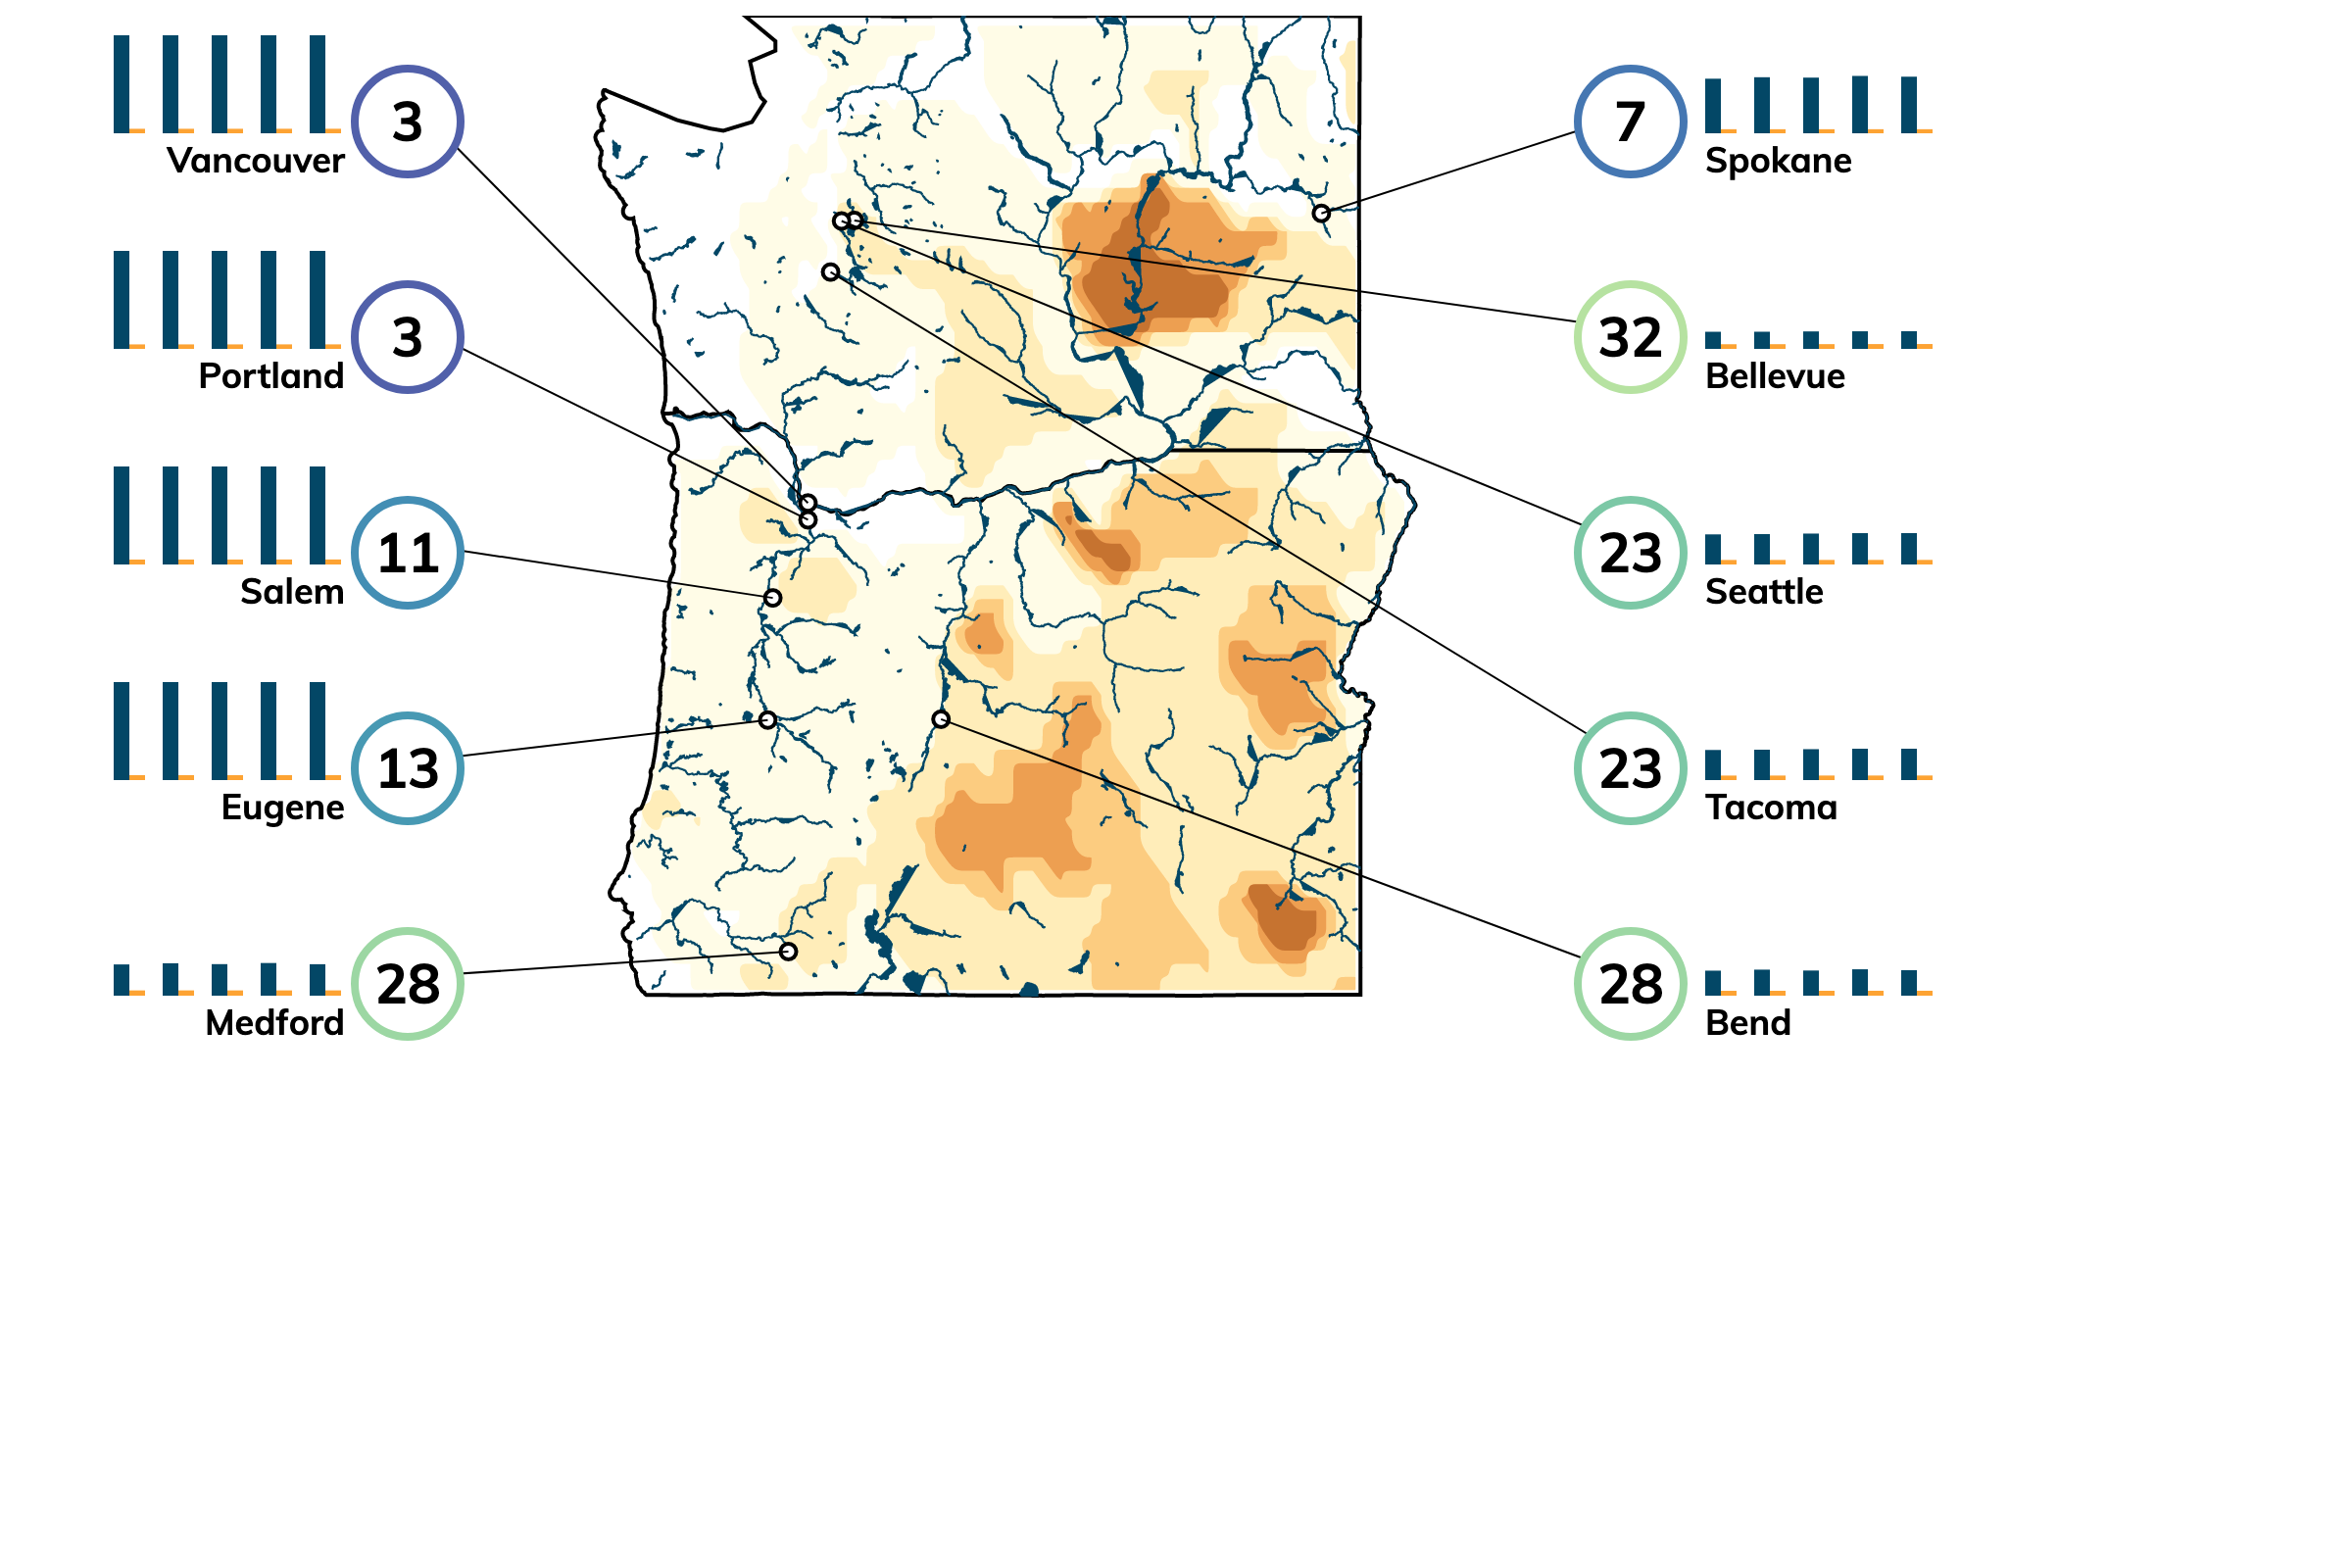
Climate Risks for Cities in Washington
Of these top cities in Washington, the city with the highest overall risk is Seattle. The city with the lowest overall risk is Yakima.
- For heat, Olympia has the lowest risk and Bellingham has the highest risk.
- For precipitation, Kennewick has the lowest risk and Olympia has the highest risk.
- For drought, Vancouver has the lowest risk and Yakima has the highest risk.
- For fire, Seattle has the lowest risk and Yakima has the highest risk.
- For flood, Spokane has the lowest risk and Olympia has the highest risk.

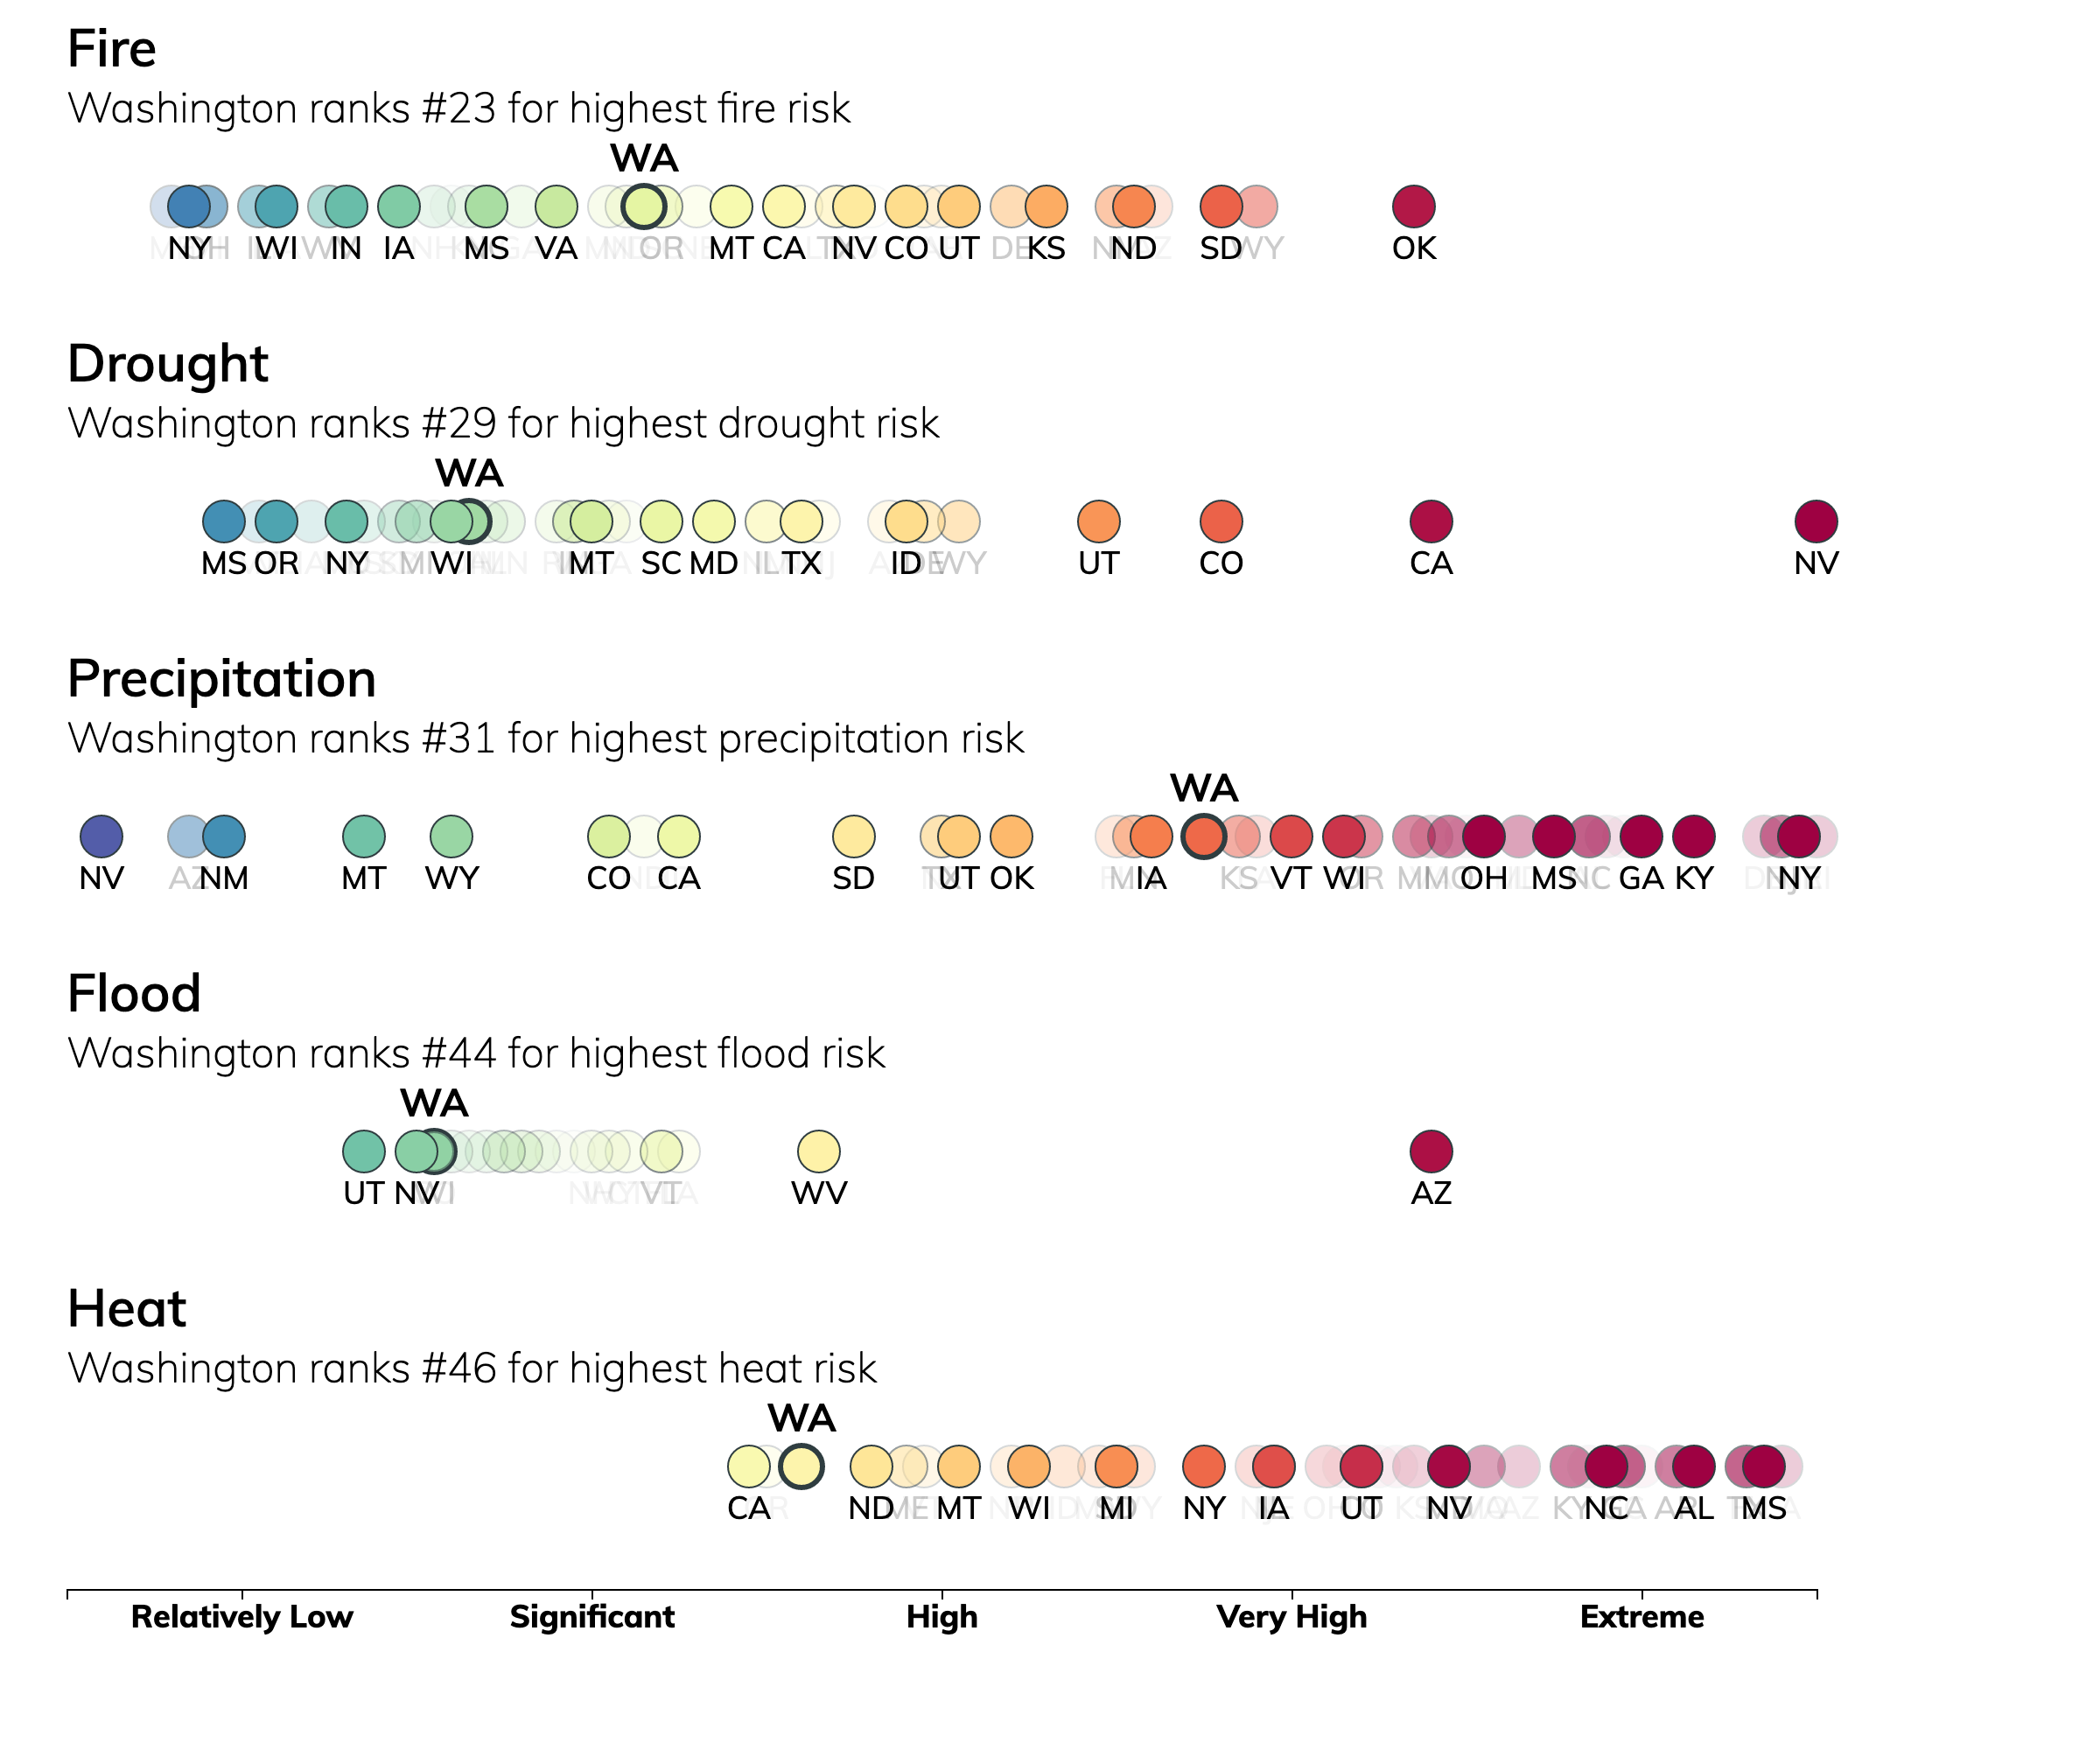
Comparing Washington and Other States
Among the lower 48 states, Washington's highest ranking is #24 for fire risk.
Oklahoma and Wyoming rank highest for fire risk Maine and Vermont rank lowest for fire risk See our fire ranking methodology.

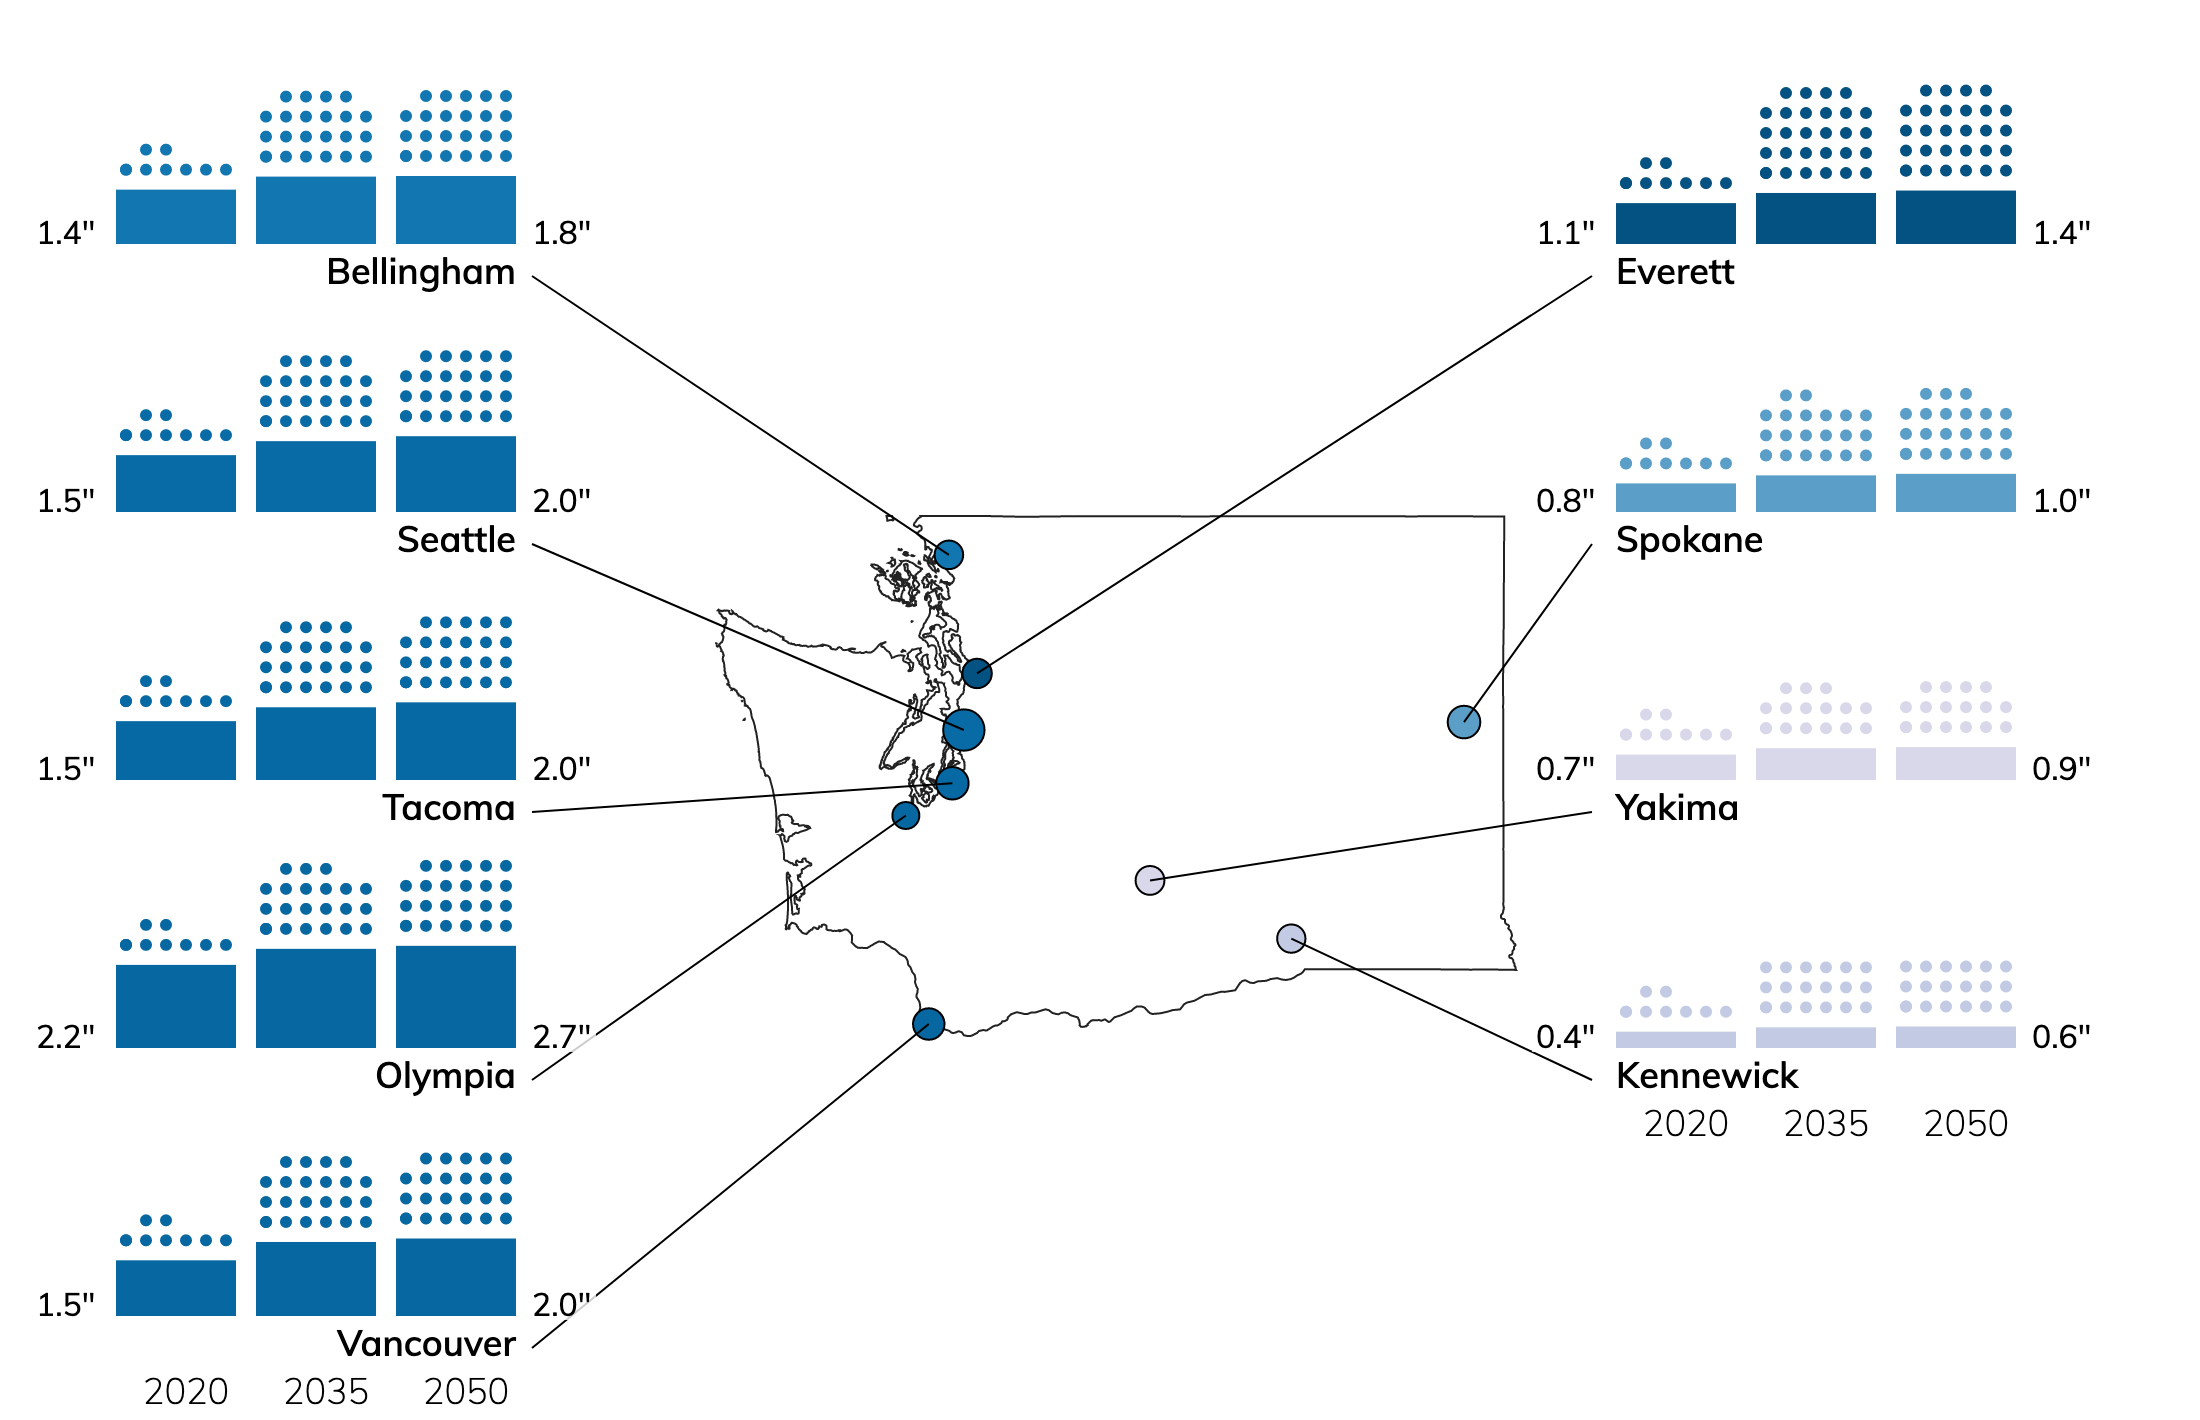
Precipitation Risk in Washington with Climate Change
To measure precipitation risk, we look at the amount of precipitation that falls in 48-hour periods exceeding a location-specific threshold, and how many times this happens per year. A precipitation threshold is based on the top 1% of rainiest days per year for a location.

Heat Risk in Washington with Climate Change
An extremely hot day in Washington depends on your location: 98ºF is extremely hot for Kennewick, while 80ºF is considered extremely hot for Bellingham. This is based on historical maximum temperatures on the top 2% of days in an average year.

The frequency of very hot days is increasing. On average, someone in Washington will experience about 28 extremely hot days in 2050.

Fire Risk in Washington with Climate Change
Locally, fire risk depends on proximity to vegetation, the type of vegetations and other landcover in the area, and topography. On a given day, fire risk is greatly increased in the presence of a red flag warning, when heat, low humidity, and strong winds converge.

Drought Risk in Washington with Climate Change
Drought risk is based on water stress, which is a projection of how much of the water supply will be taken up by human demand.

How can we prevent climate change and protect our homes and communities?
Mitigating climate change—by eliminating our emissions into the atmosphere and reducing our strain on the environment—and adapting to our changing planet are both vital to our well-being.
Understand Risks
Check your address and get a free report describing risks to your property and in your area.
Protect Homes and Communities
Check our free report for tips on protecting your home from hazards.
Find Balance