What are the FEMA Zone Flood Maps?
FEMA flood zone maps are a powerful tool to help identify the dangers of flooding in your area. The maps, known officially as Flood Insurance Rate Maps (FIRMs), show designated flood zones of high, moderate, and low flood risk. FEMA and mortgage lenders use these flood maps to help determine flood insurance rates. First established after the congress created the National Flood Insurance Program (NFIP) in 1968, these maps are a free public service available at the FEMA Flood Map Service Center, and are also made available through third parties including ClimateCheck.com property reports.
FEMA maps are based on:
- historic meteorological, hydrologic, and hydraulic data
- open-space conditions
- flood-control works
- development
They are updated frequently according to changes in land, environment, climate, or development. Flood Insurance Study (FIS) reports are a great resource for understanding the changing nature of your regional flood risk in recent years.
Floods are a natural process of our environment and can potentially occur across all of the United States. River and coastal flooding are two of the most prevalent types of floods, but burst dams, construction projects, or sudden rains can put you at risk of flood damage even when you are not in the vicinity of a large body of water. Floods spread unpredictably and do not match up to property or city lines; maps can therefore help you understand your geographical relationship to areas of high flood risk.
Features of the FEMA flood zone maps include:
- Title box, legend, body, and basic symbols
- Common physical features such as major highways, secondary
- roads, lakes, railroads, streams, and other waterways
- Special Flood Hazard Areas (SFHA)
- Base flood elevation (BFE) or depths and flood insurance risk zones
- Areas subject to inundation by the 500-year flood

Reading your Local Flood Zone Map
Below are some tips for understanding the specifics of what these maps convey. There are at least two types of flood map, the “Flat Flood Map” and the “Z-Fold Flood Map”; for the most part, they contain similar features.
- Map Scale
This allows you to relate distances measured on the Flood Map to actual distances on the ground. The scale shown on a panel applies only to that panel. The most commonly used scales are where one inch on the map equals 500, 1000, or 2000 feet on the ground. - Panel Number
Each panel is given a distinct number which distinguishes it from others in the same Community. - Flood Insurance Risk Zone Designations
Zone designations indicate the magnitude of the flood hazard in specific areas of a community. Flood zones are designated with letters such as 'A', 'AE', 'X', etc. If you are within a Hazard Area, a dark tint indicates areas of greater flood hazard and light indicates areas of lesser flood hazard. For more information, see our article on FEMA flood zone designations. - Special Flood Hazard Area (SFHA)
These are areas rated ‘high risk’ and defined as having at least a 1% chance of experiencing flood each year. They are shown on the FEMA maps as zones beginning with the letters ‘A’ or ‘V’. Homes in these areas with federally regulated or insured lenders are required to have flood insurance. - Non-Special Flood Hazard Areas
These are moderate risk areas where risk is reduced but not completely absent. These are shown with the letters: ‘B’, ‘C’ or ‘X’. Homes within this area have been historically responsible for 20 percent of National Flood Insurance Program claims and have received one third of federal disaster funding for flooding according to FEMA. Flood insurance isn’t federally mandated in these regions, but it is recommended. - Undetermined Flood hazard Areas / Unstudied Areas
Shown beginning with the letter ‘D’. Flood insurance rates in these areas are likely to reflect unknown risks and uncertainty. - River Mile Marker / Stream Line
Markers identify the distance in miles from a reference point on a river or other major watercourse. In the case where the stream goes directly through the area of interest, a “stream line” identifies the location of a watercourse. Narrower streams are shown by a single line representing the approximate location of the center of the waterway. Wider streams are often shown by double lines which represent stream bank locations. - 100-Year Flood
Contrary to its name, the 100-year flood is not the severity of a flood that occurs once every 100 years. The 100-year flood is defined as flooding that has a 26% chance of occurring during a 30 year period. It is a regulatory standard used by Federal agencies to administer floodplain management programs and is the basis for insurance programs across America; it is therefore based around a 30 year period common for many home mortgages. - Floodplain Boundary / Base Flood Elevation (BFE)
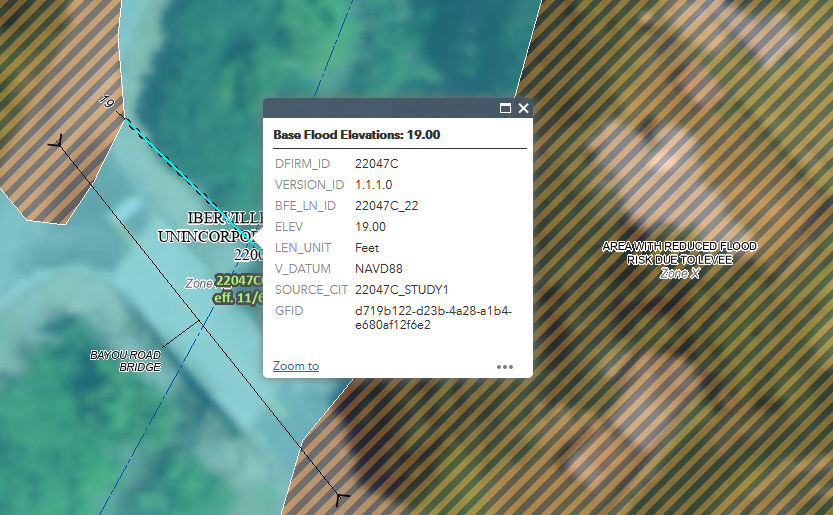
The floodplain boundary shows the 100-year and 500-year floodplains. Additional detailed lines are available in some study areas indicating base flood elevation. These show the level water is expected to rise to in the case of a base flood, or 100-year flood, in relation to geographic data in Special Flood Hazard Areas. A wavy line is used to designate where the base flood elevation varies along a watercourse; a straight line is used when the flood elevation is uniform across a large area.

How are FEMA Maps Related to the National Flood Insurance Program (NFIP)?
The National Flood Insurance Program is administered by FEMA. FEMA works closely with more than 80 private insurance companies to offer flood insurance to homeowners, renters, and business owners. The cost of the insurance that they provide varies depending on how much insurance is purchased, what it covers and the property's flood risk. In addition, in order to qualify for flood insurance, your home must be in a community that has joined the NFIP and agreed to enforce sound floodplain management standards. Insurance can only be purchased through an agent, not directly through the NFIP.
How Homeowners and Buyers Can Use FEMA Flood Zone Maps
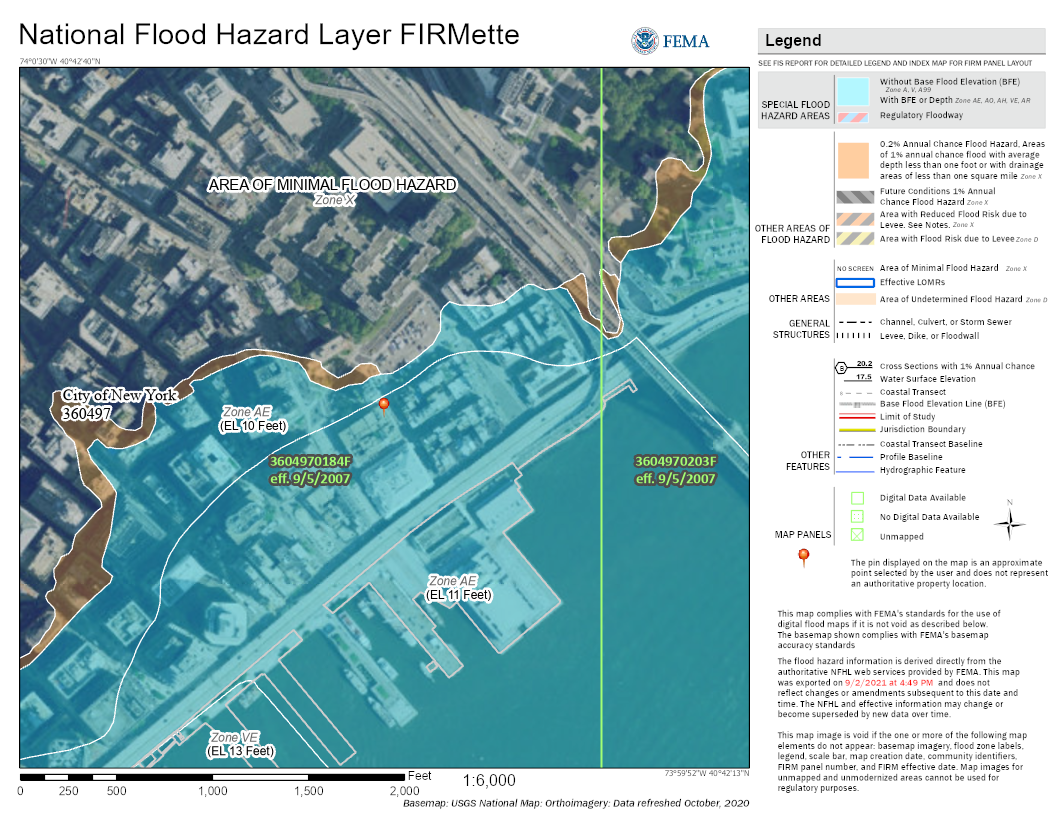
Reviewing the flood maps of your area is the first step towards understanding your risk. To make the FEMA maps more customized to the individual homeowner, FEMA offers the option to easily print a single section of the larger FIRM. This “FIRMette” is a printable and savable map document of a user-customized portion of a FEMA flood map. See here for instructions on using this process.
Note that if you disagree with FEMA flood zone designations for your property, you can submit a Letters of Map Change (LOMC) form to FEMA to request a review and update. If your property is actually at less risk of flooding than FEMA maps signify, you could same money on flood insurance.
Once you are aware of your flood risk, you may wish to take steps to mitigate your risk levels. These include building outside of high-risk flood zones, considering changes and retrofitting of your current property, buying flood insurance, and remaining prepared for future flood events.
Get an Instant Risk Assessment
Select...