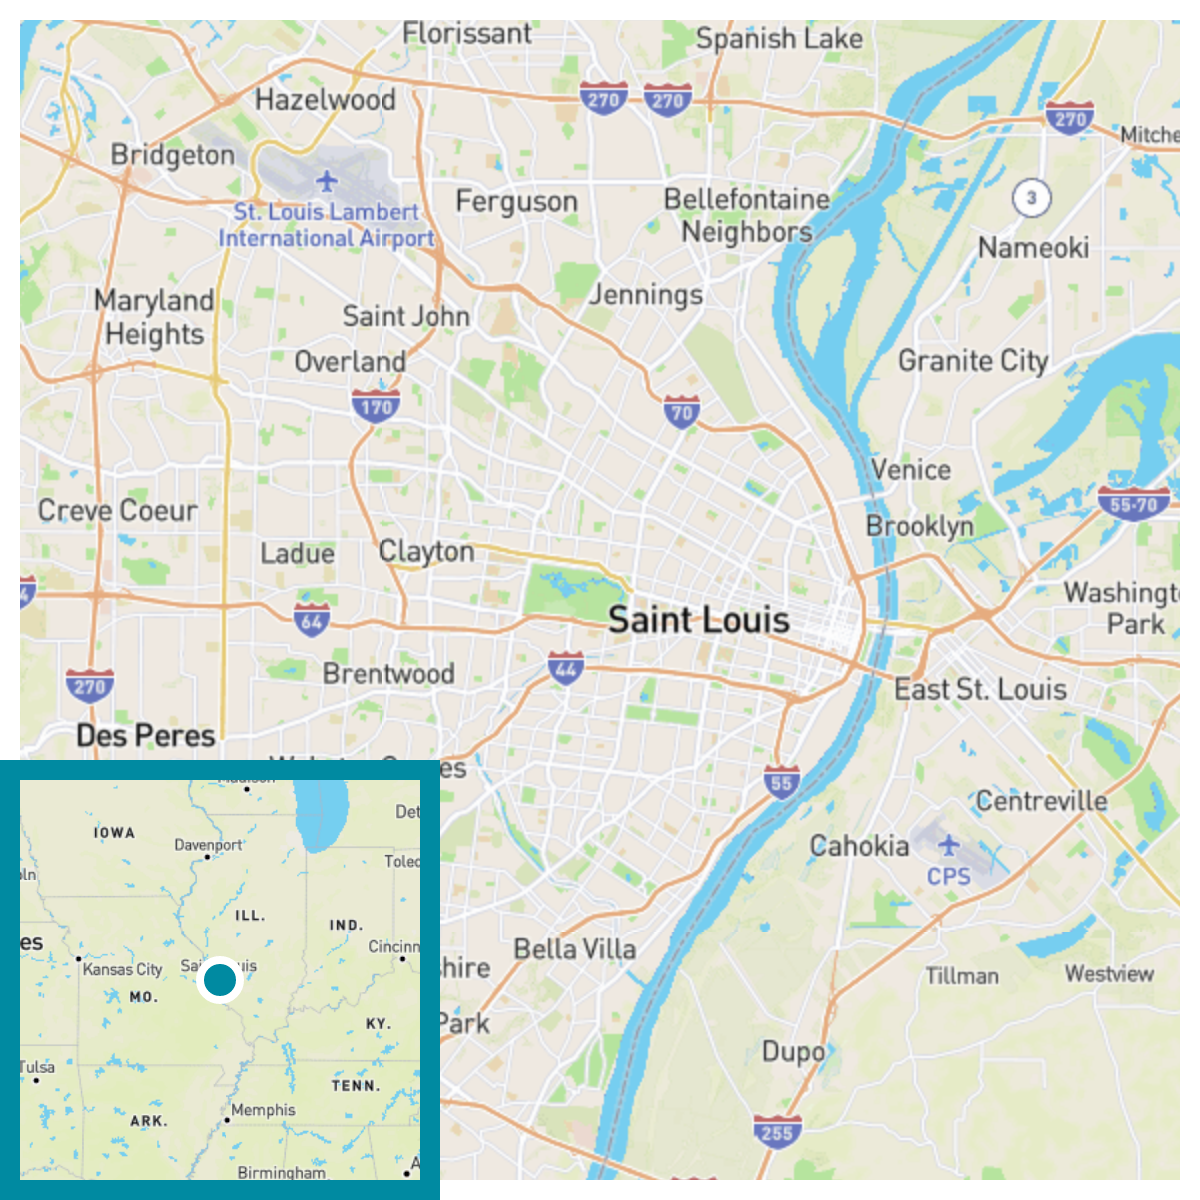
St. Louis, MOTop Climate Change Risks: Heat, Precipitation, Flood
Risk Snapshot
Climate Change Hazard Ratings for St. Louis, MO
Ratings represent risk relative to the contiguous United States. 100 is the highest risk for the hazard and 1 is the lowest for the U.S., but does not indicate no risk. Flood and fire are rated based on the buildings in St. Louis exposed to these hazards. See hazard sections below and check your address for details.


Get an Instant Risk Assessment
People in St. Louis, MO are especially likely to experience increased risks from heat, precipitation, and flood.
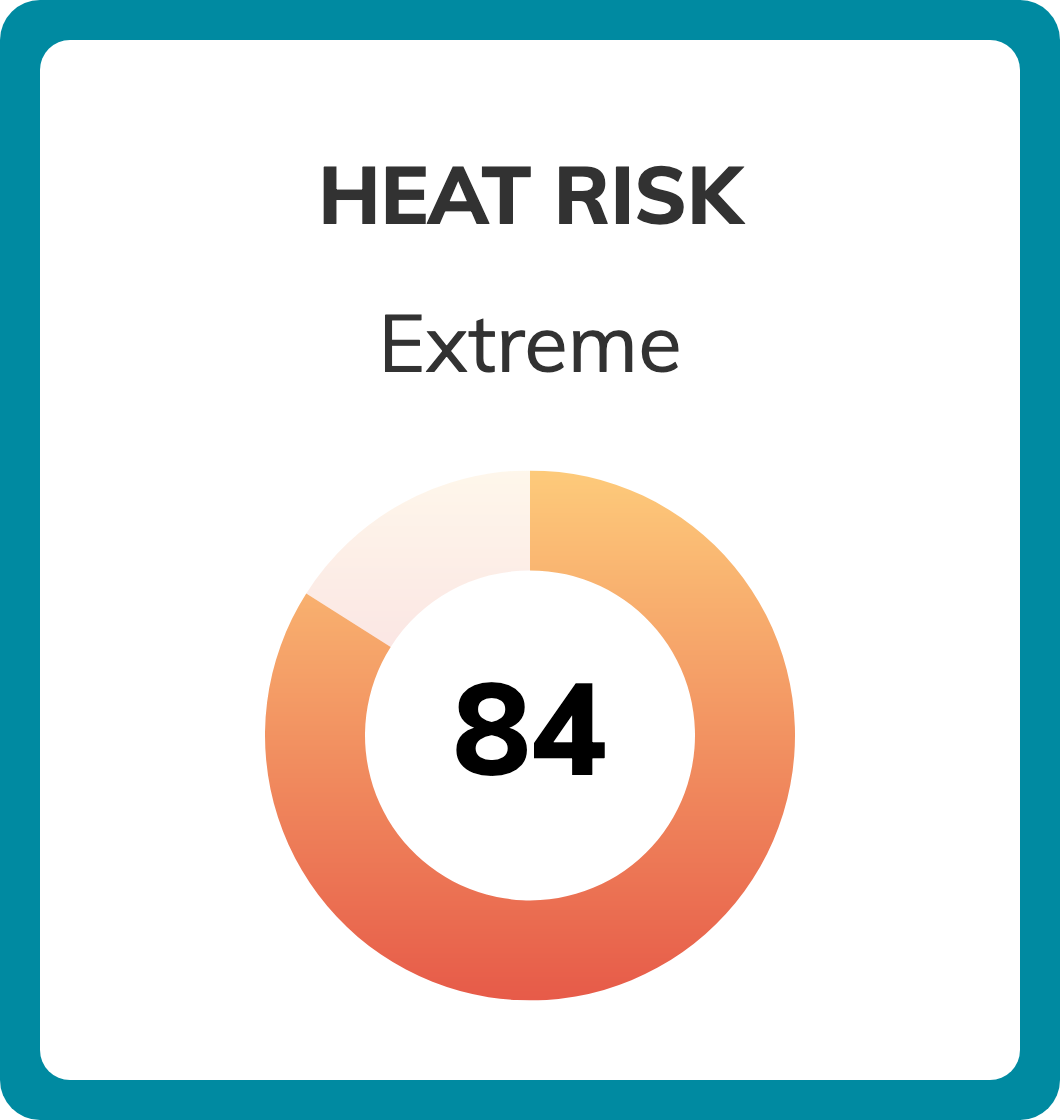
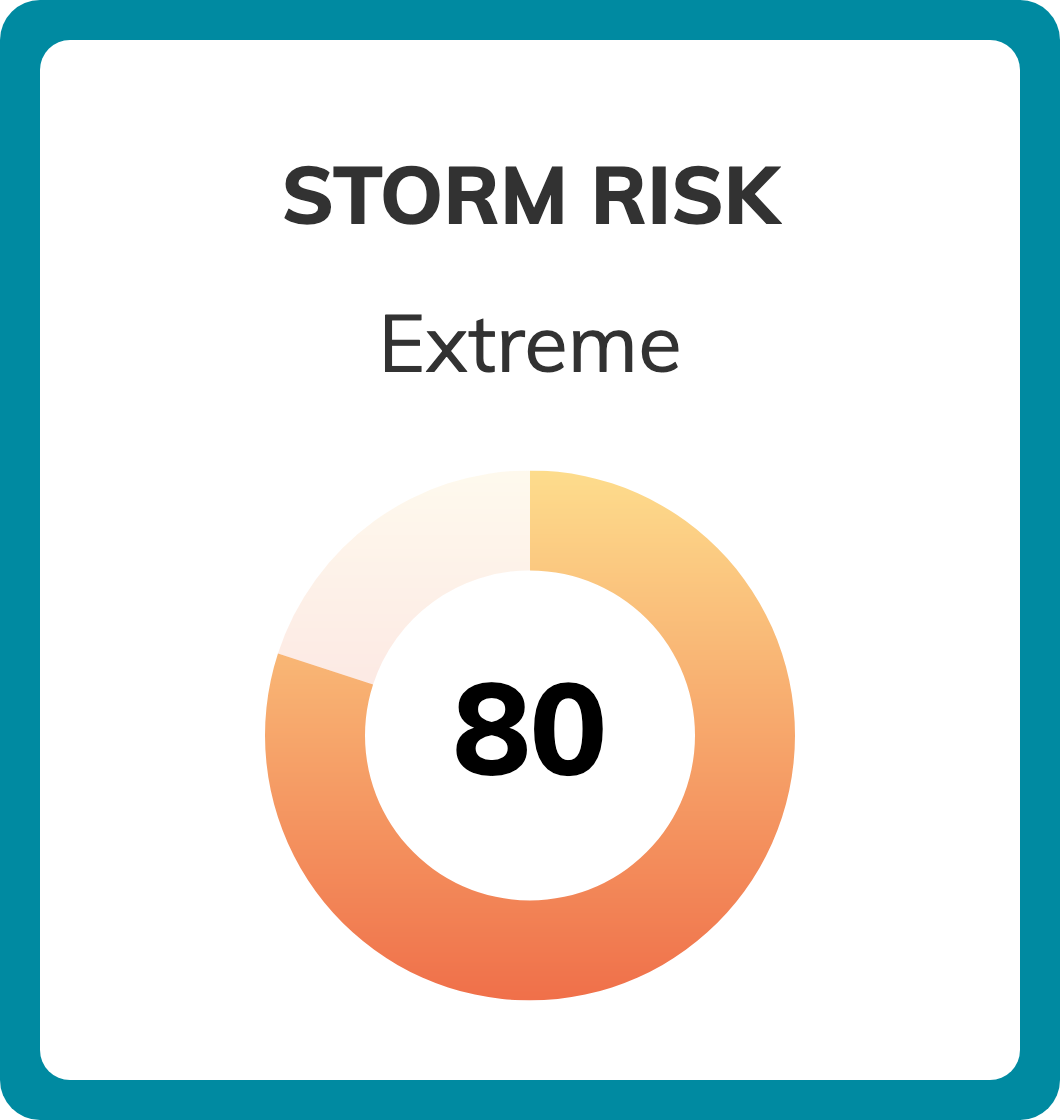
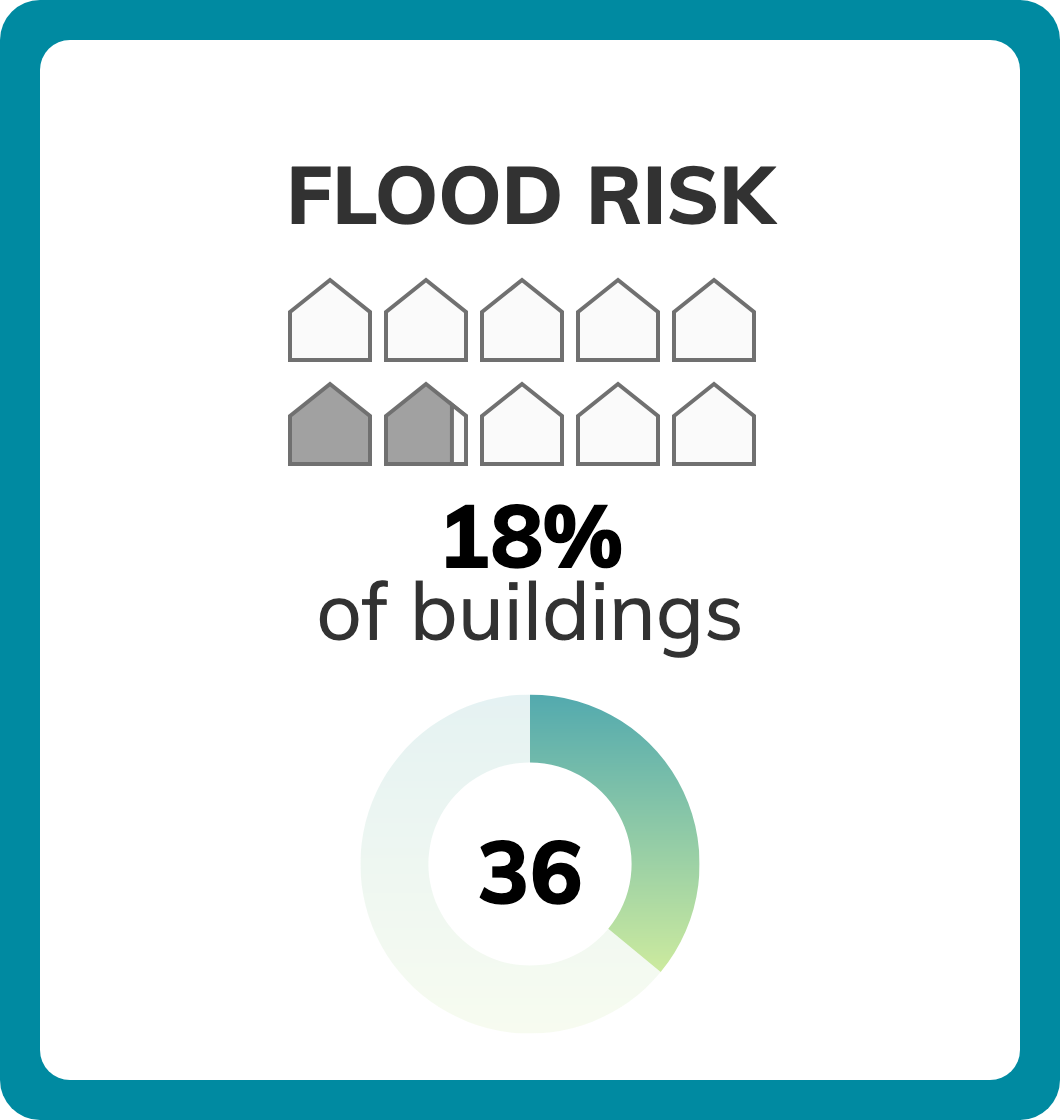
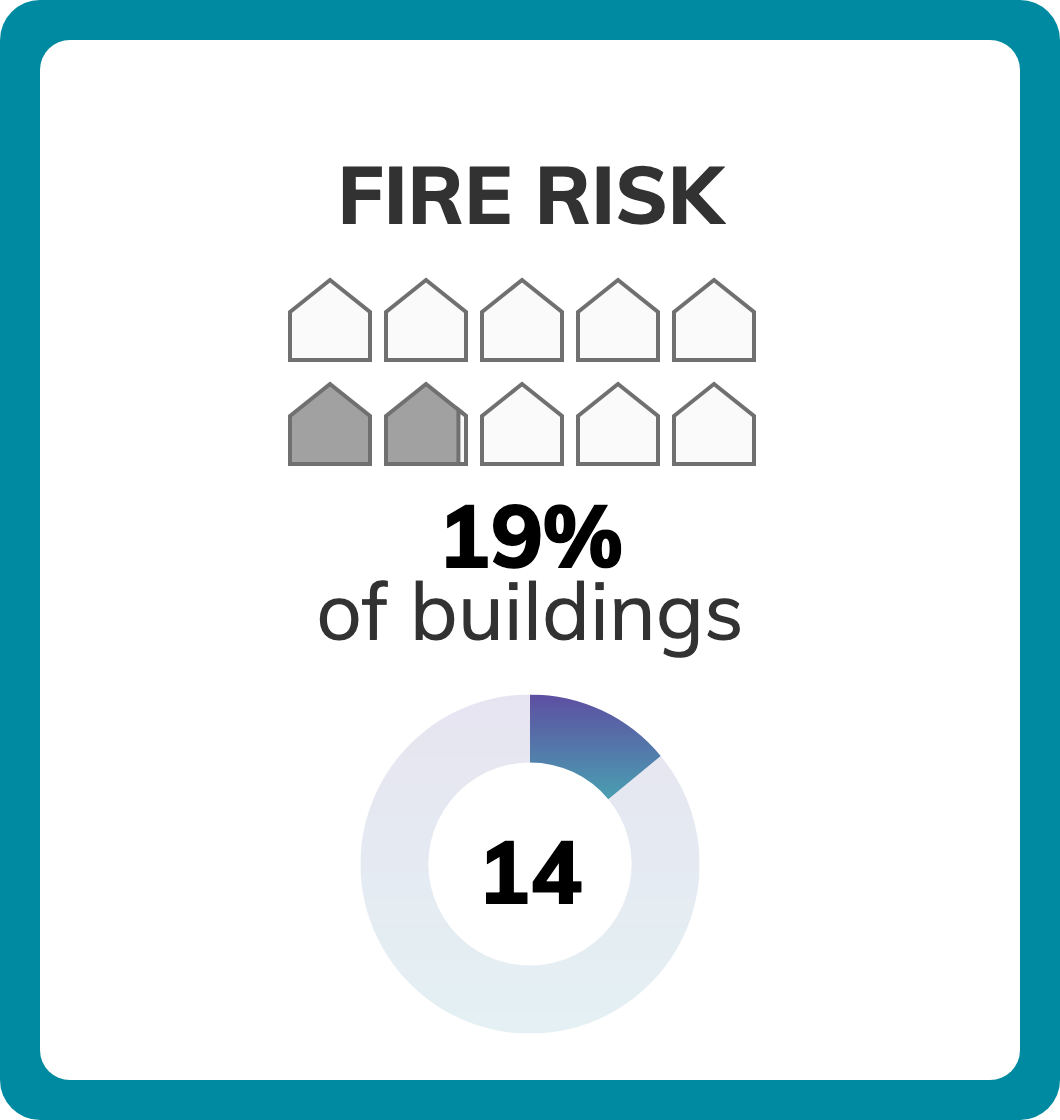
Heat and precipitation risk in St. Louis, MO is extreme. Drought risk is relatively low. About 18% of buildings in St. Louis, MO are at risk of flooding, and the risk level for these buildings is significant. About 19% of buildings in St. Louis, MO are at risk of wildfire, and the risk level for these buildings is relatively low.

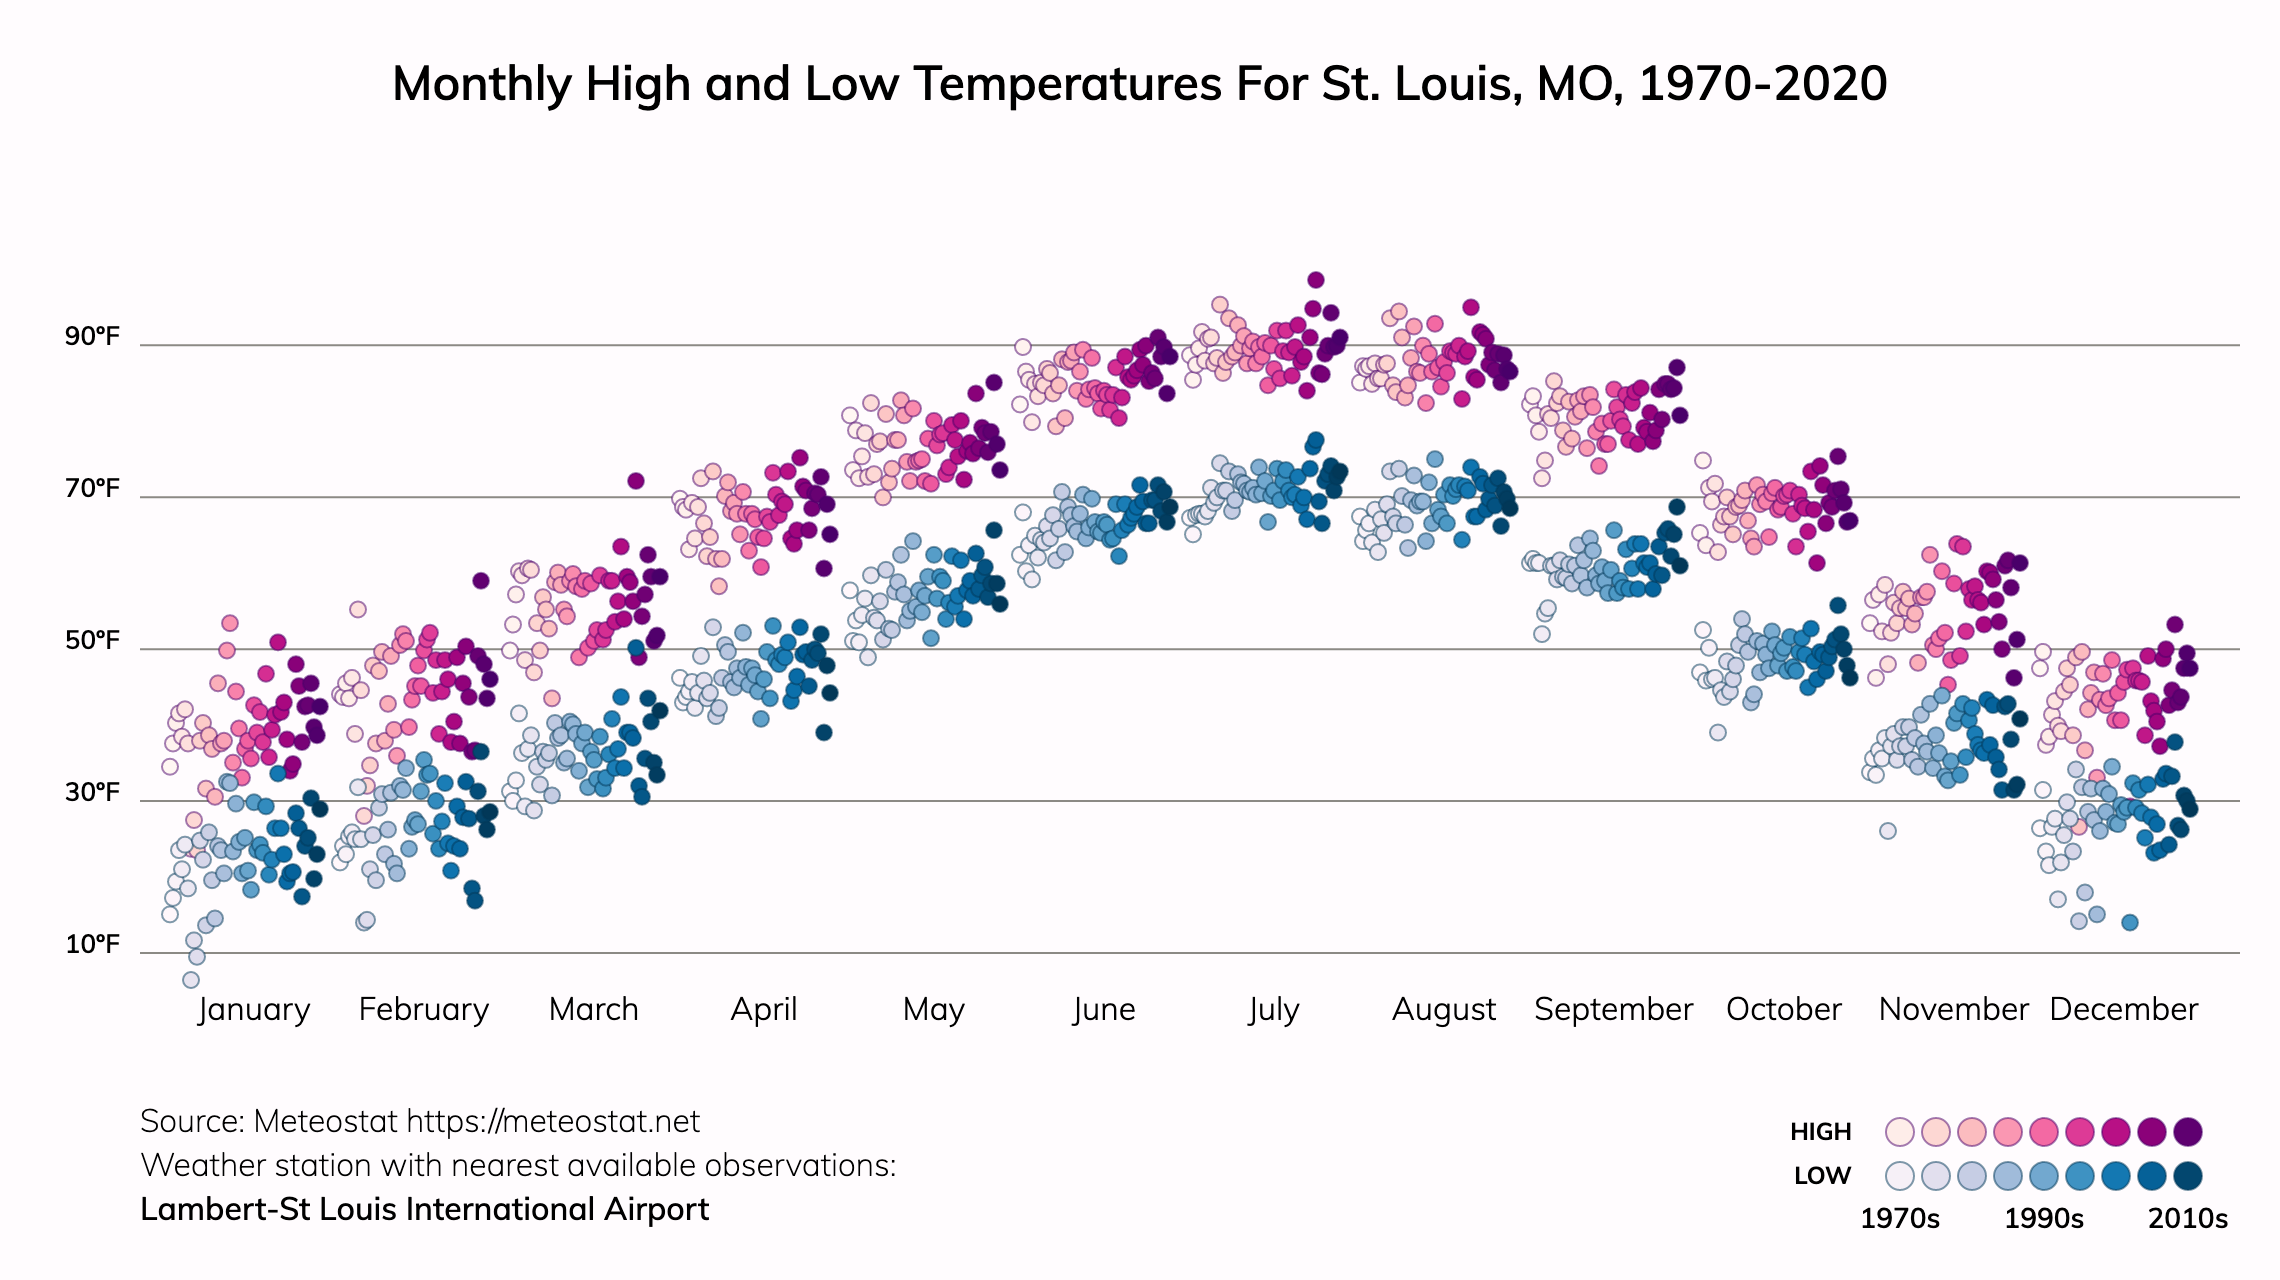
Heat risk in St. Louis, MO
The number of the hottest days in St. Louis is projected to keep increasing.

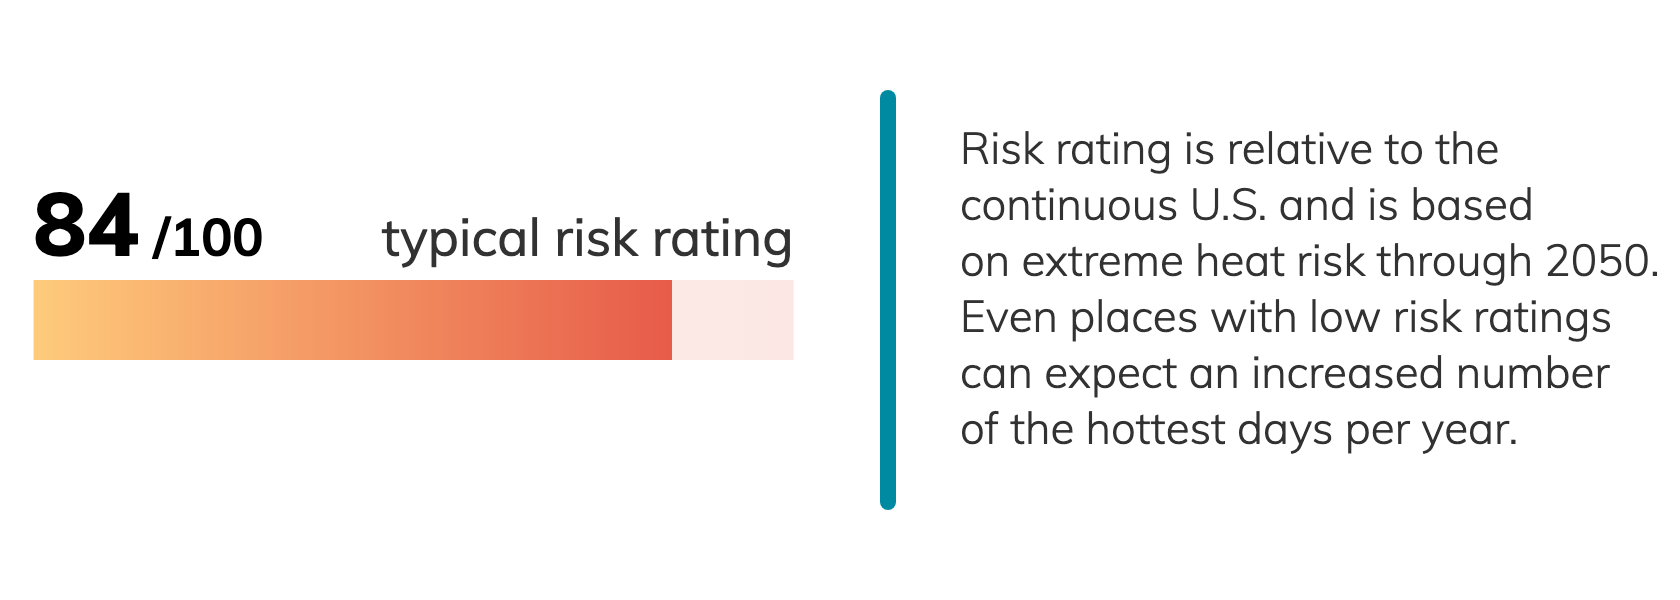
In a typical year between 1985-2005, people in St. Louis, MO experienced about 7 days above 96.0ºF in a year. By 2050, people in St. Louis are projected to experience an average of about 44 days per year over 96.0ºF.

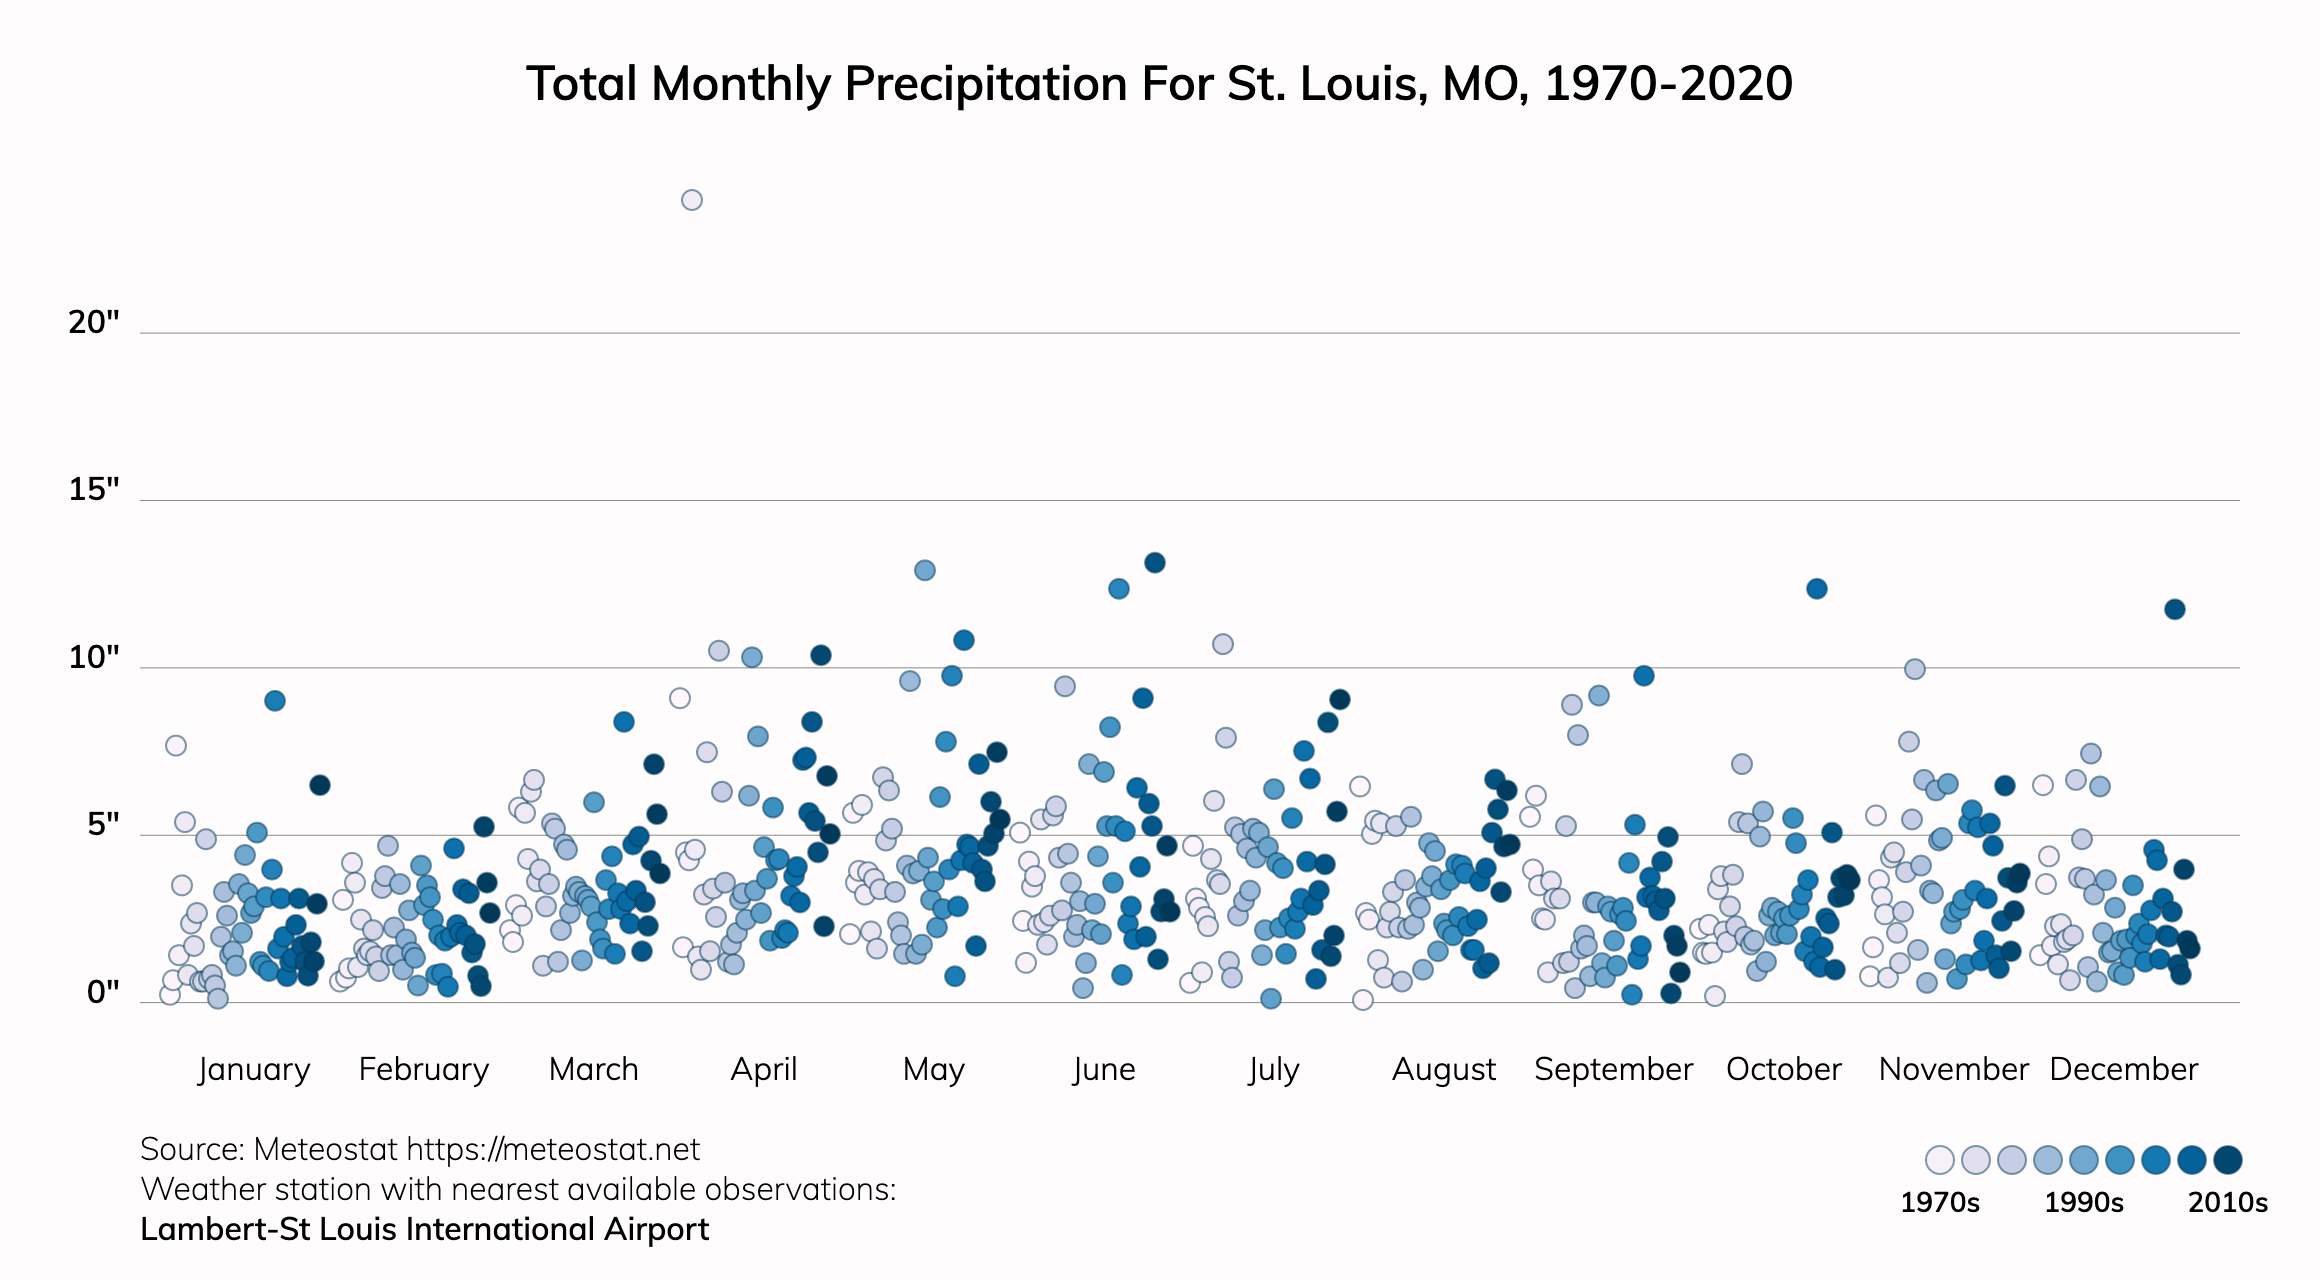
Precipitation risk in St. Louis, MO
The amount of precipitation during the most extreme days in St. Louis is projected to increase.
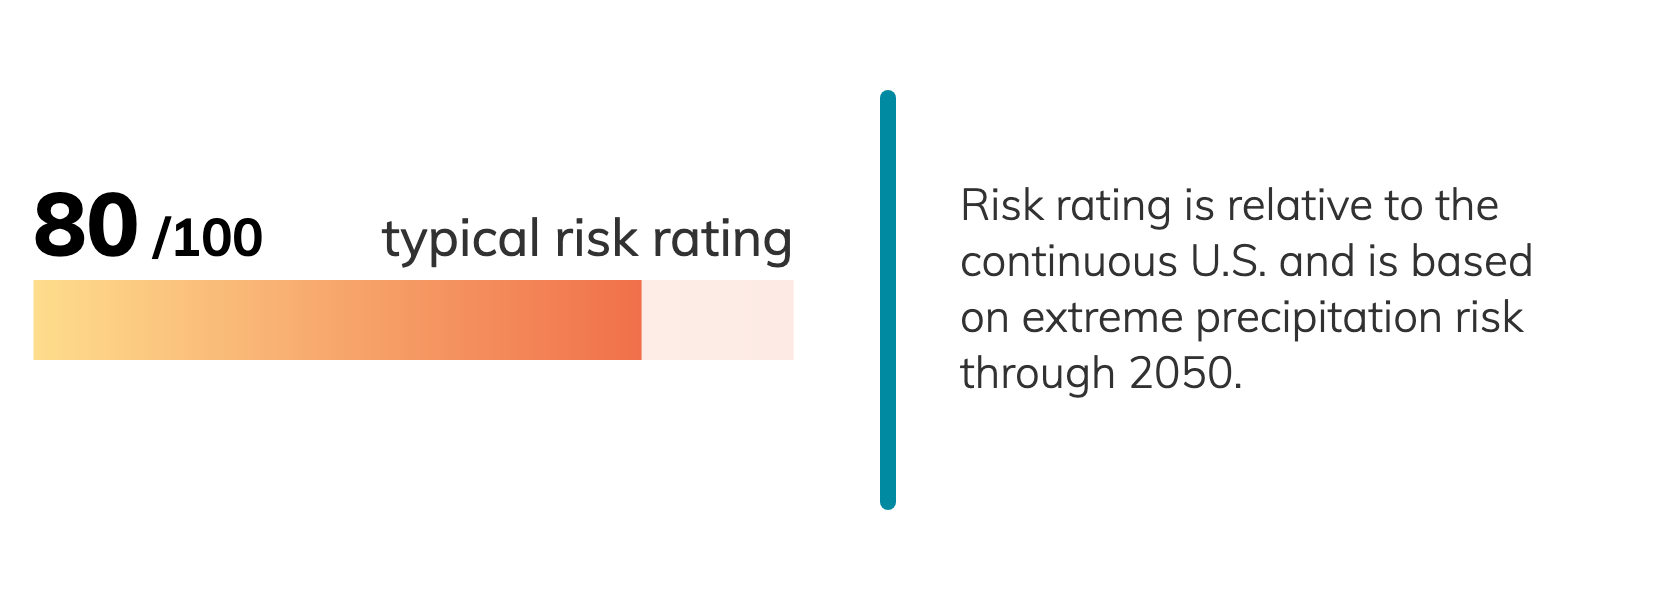
An extreme storm for St. Louis, MO is a 48-hour rainfall total greater than 0.9 inches. Historically, about 16.2" of rain (or the equivalent in snow) fell over about 11 storms each year. By 2050, about 18.4" of rain are projected over about 13 storms each year. The annual precipitation in St. Louis, MO is projected to increase from about 39.2" to about 41.0".

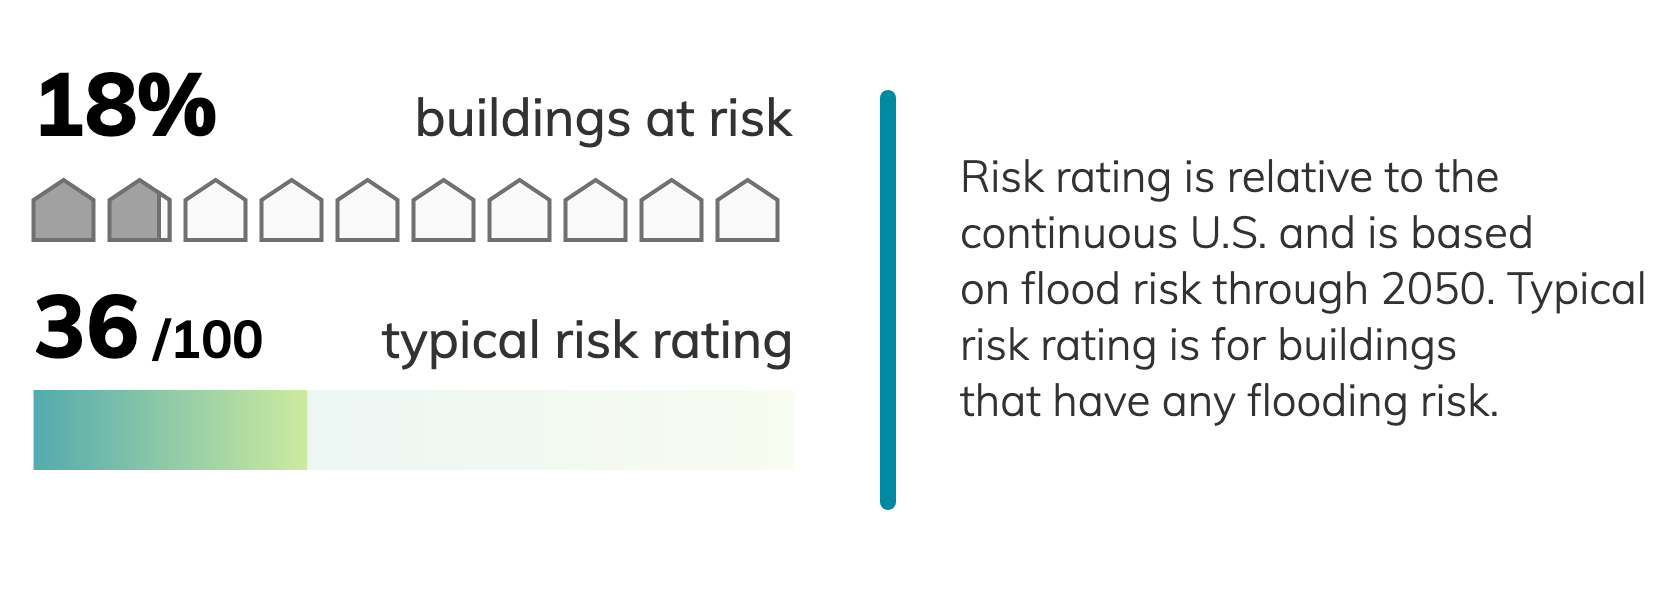
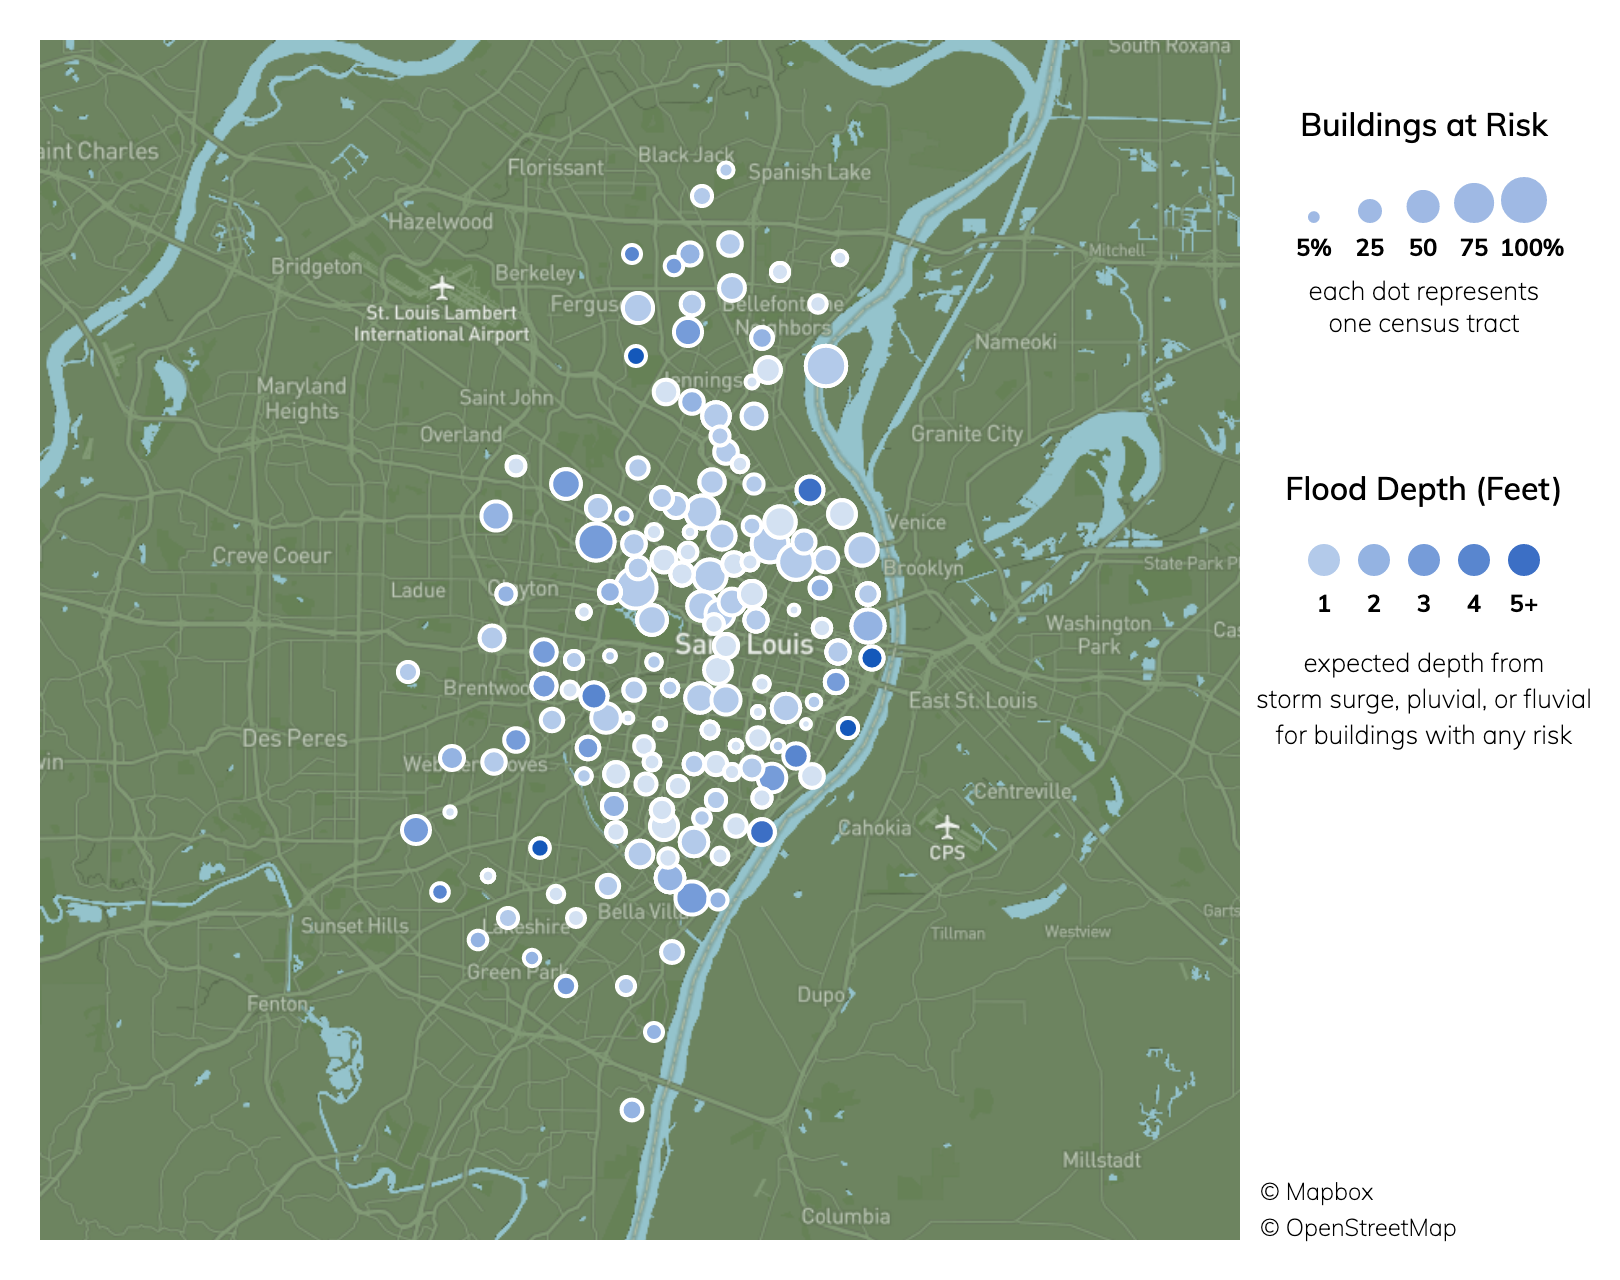
Flood risk in St. Louis, MO
Buildings at risk in St. Louis average about a 32% chance of a flood about 1.5 feet deep over 30 years.
Of 261 census tracts in St. Louis, MO, there are 9 where more than half of buildings have significant risk from surface (pluvial) flooding and riverine (fluvial) flooding.Property owners can check a specific address for flood risk including FEMA flood zone, then take steps to reduce their vulnerability to flooding damage.

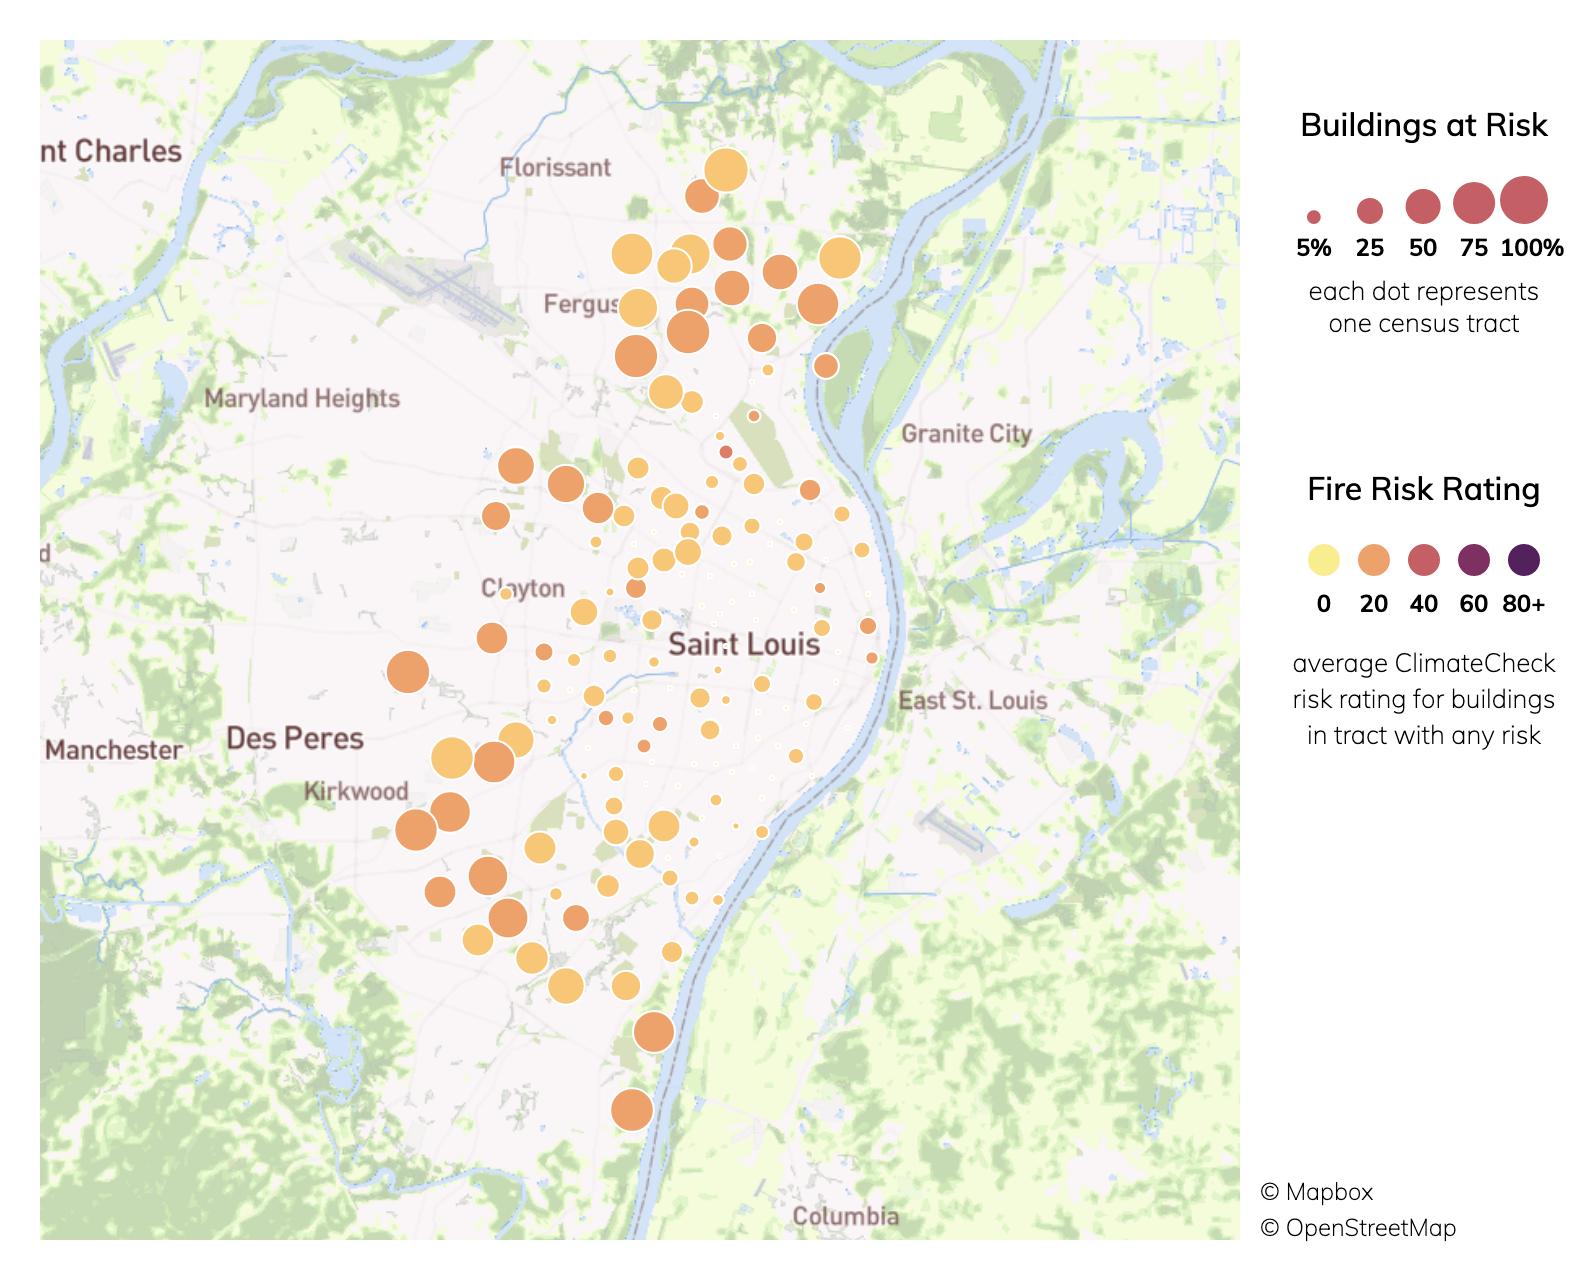
Fire risk in St. Louis, MO
The risk on the most dangerous fire weather days in St. Louis is low. The number of these days per year is expected to increase through 2050.
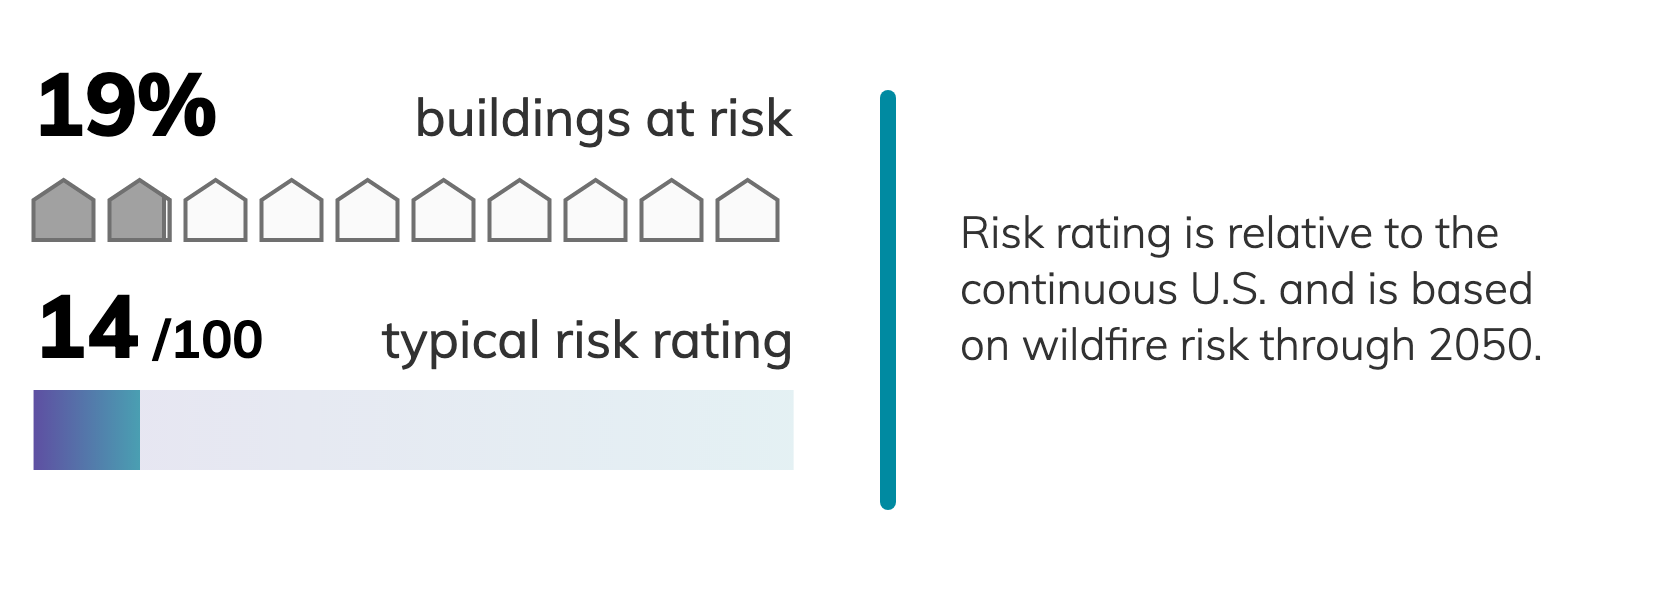
Of 261 census tracts in St. Louis, MO, there are 57 where more than a quarter of buildings have significant fire risk, and 31 where more than half of buildings have significant fire risk. Property owners can take steps to mitigate their risks from wildfires.

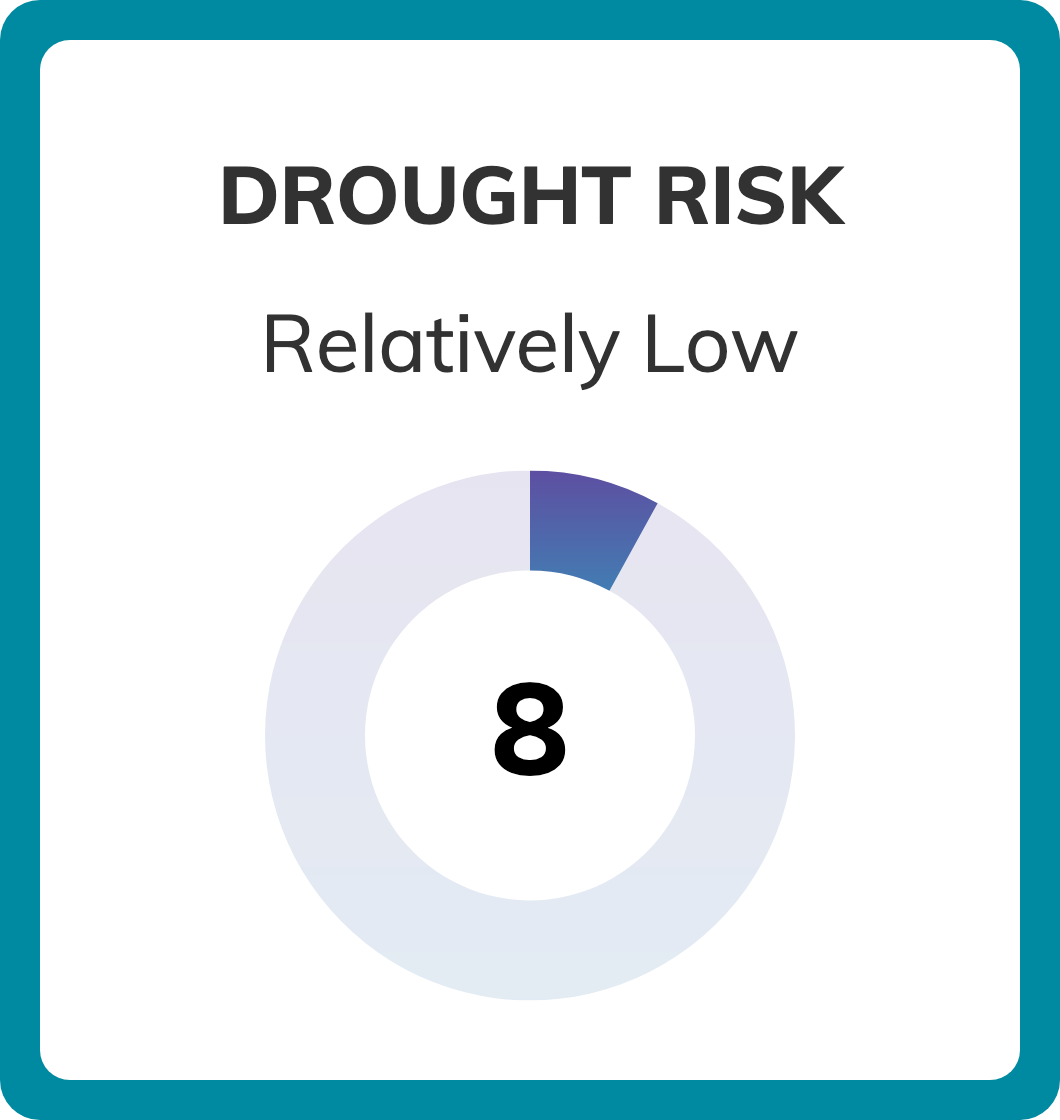
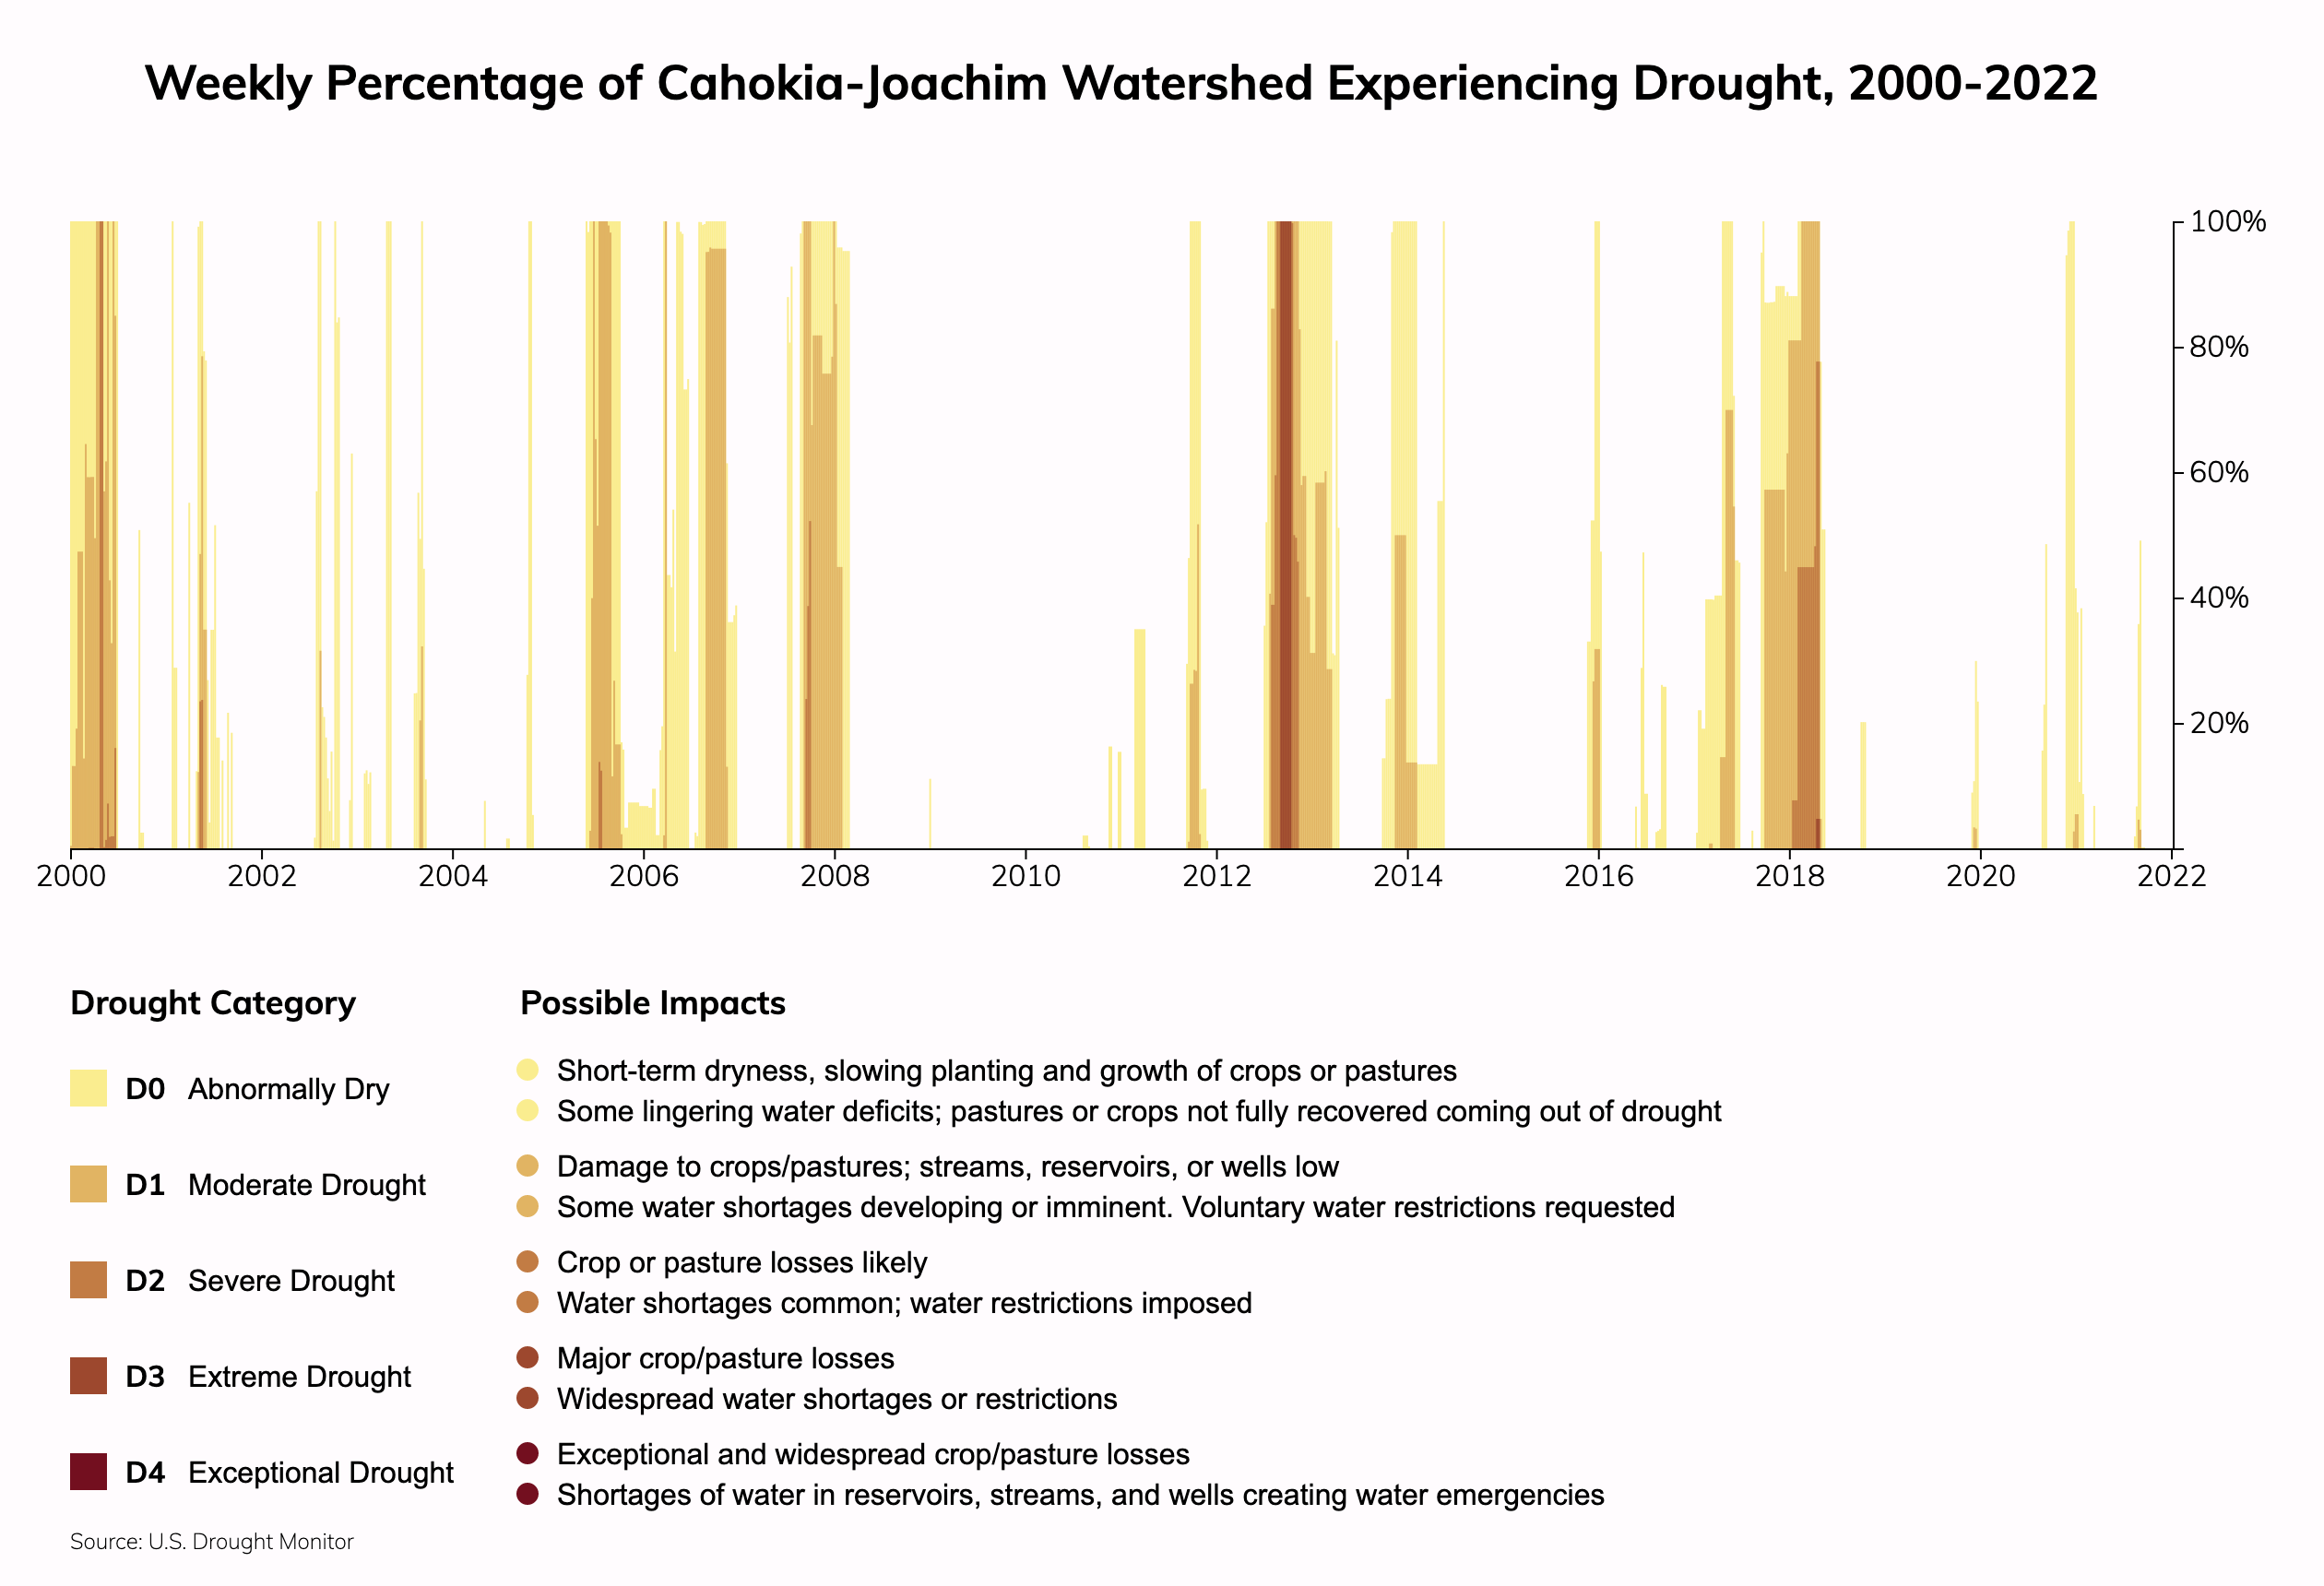
Drought risk in St. Louis, MO
The recent average water stress in St. Louis is low and projected to remain about the same through 2050.
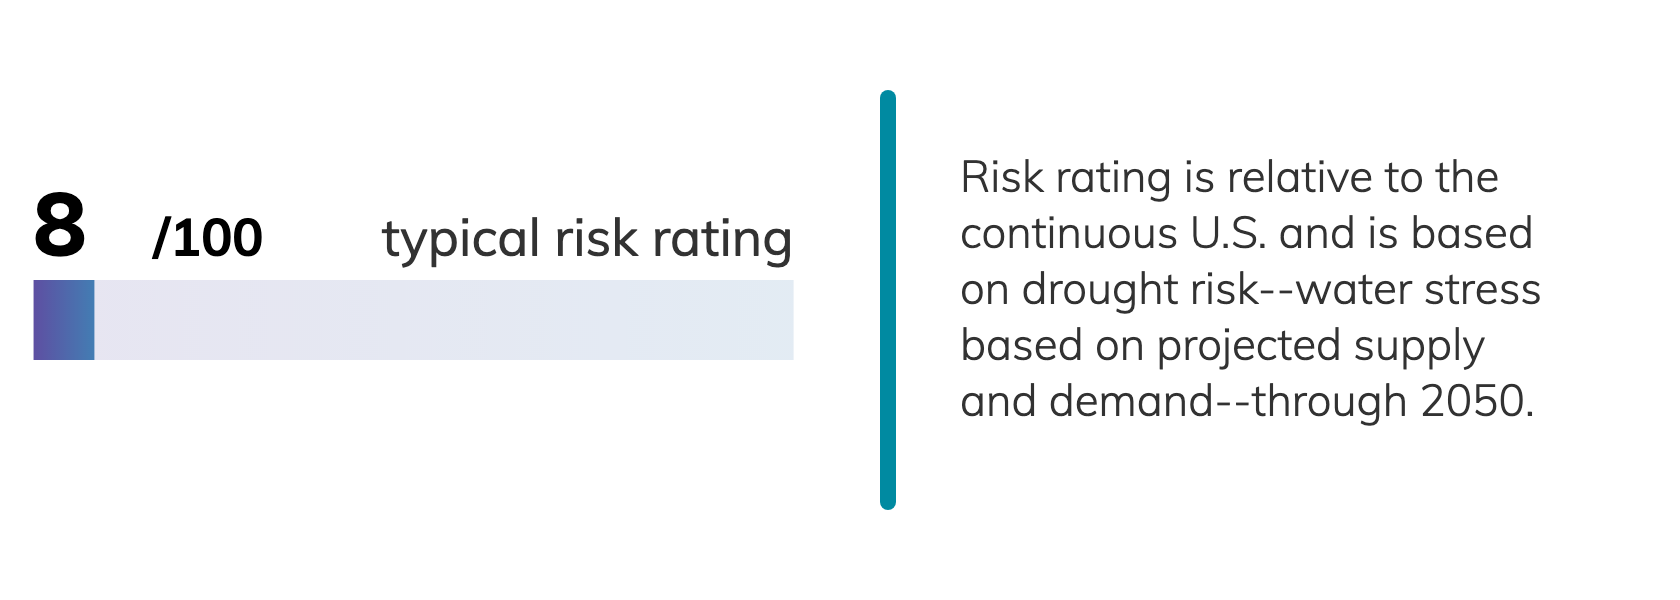
The Cahokia-Joachim watershed, which contains St. Louis, MO, has experienced 405 weeks (36% of weeks) since 2000 with some of its area in drought of any level, and 8 weeks (1% of weeks) since 2000 with some of its area in Extreme or Exceptional drought. Source: National Drought Monitor.

How can we prevent and adapt to climate change?
Mitigating climate change, by eliminating our emissions into the atmosphere and reducing our strain on the environment, and adapting to our changing planet are both vital to our well-being.
Understand Risks
The risks presented on this page reflect averages for St. Louis, MO and can vary for individual properties. Check your address and request a report describing risks to your property and in your area.
Protect Homes and Communities
Check our free report for tips on protecting your home from hazards.
Find Balance
Reducing emissions is necessary and possible across the globe and in every part of our society. Learn more with the Project Drawdown introduction to climate solutions.