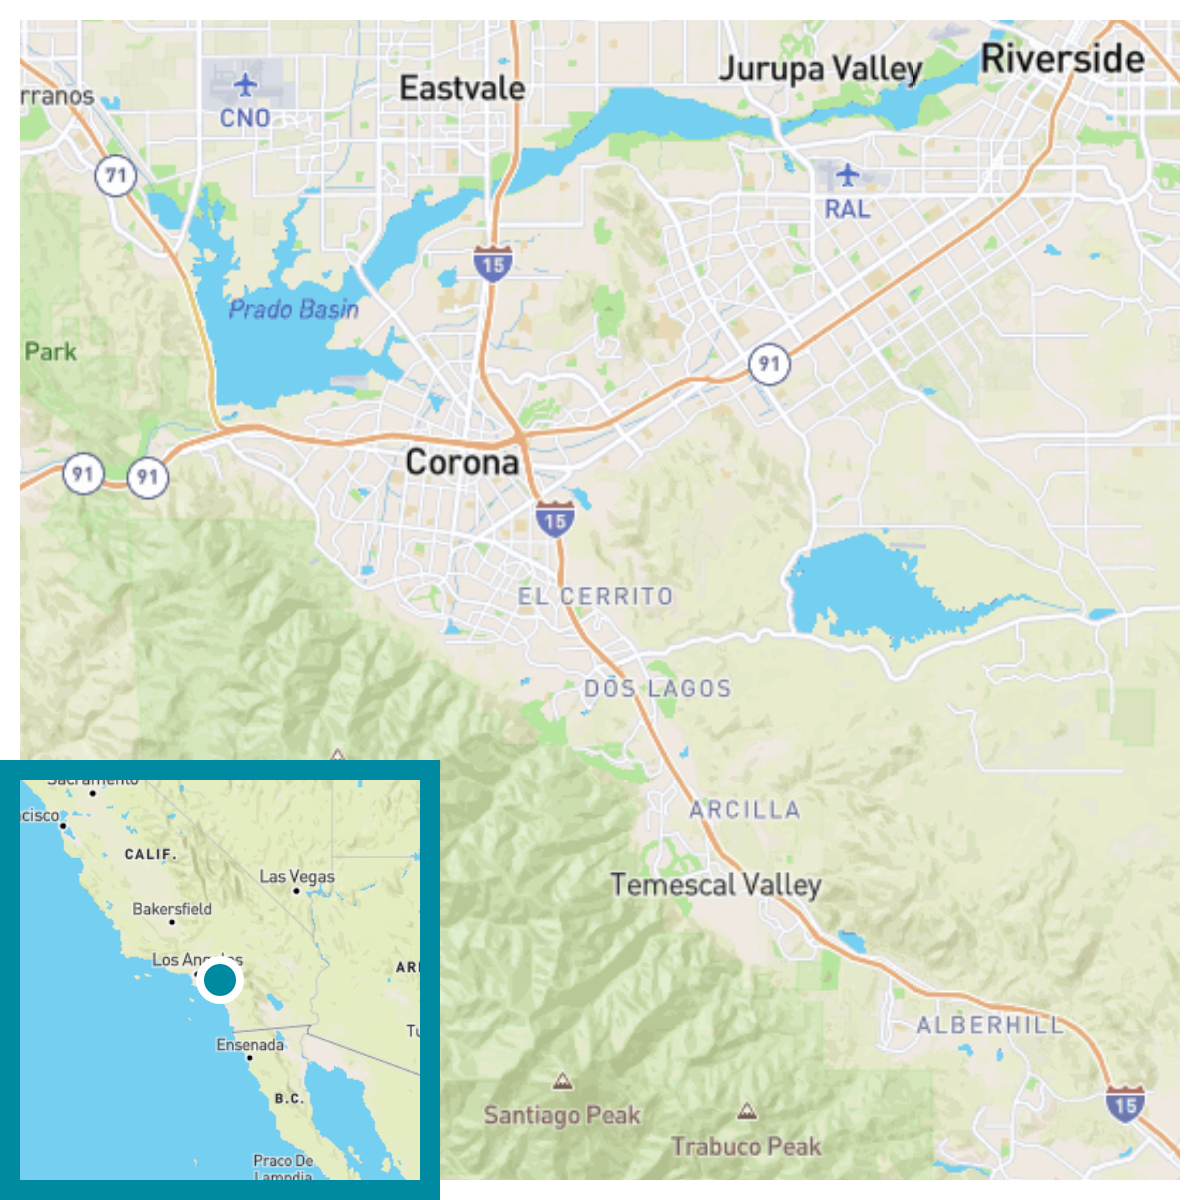
Corona, CATop Climate Change Risks: Fire, Heat, Drought
Risk Snapshot
Climate Change Hazard Ratings for Corona, CA
Ratings represent risk relative to North America. 100 is the highest risk for the hazard and 1 is the lowest, but does not indicate no risk. Flood and fire are rated based on the buildings in Corona exposed to these hazards. See hazard sections below and check your address for details.


Get an Instant Risk Assessment
People in Corona, CA are especially likely to experience increased risks from fire, heat, and drought.
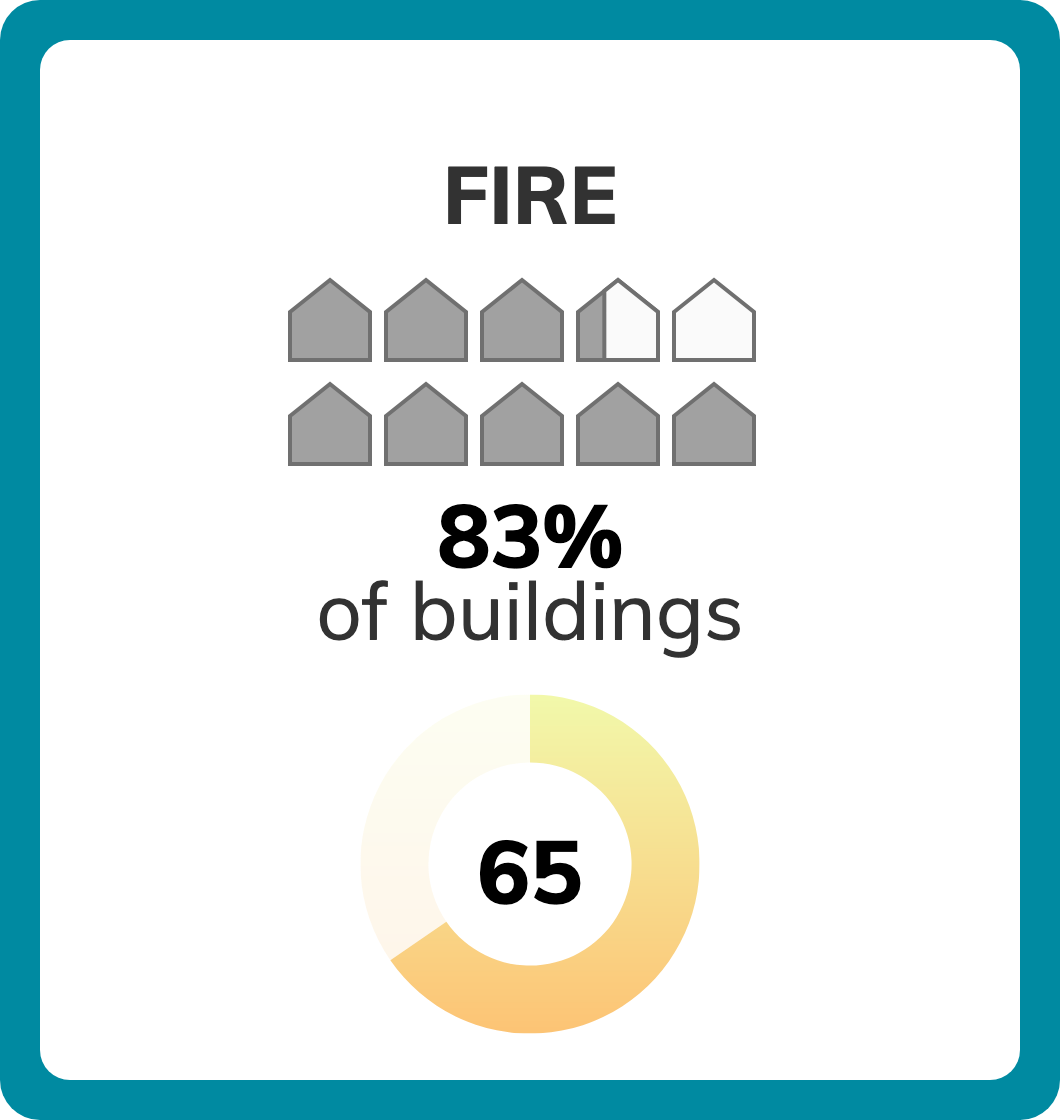
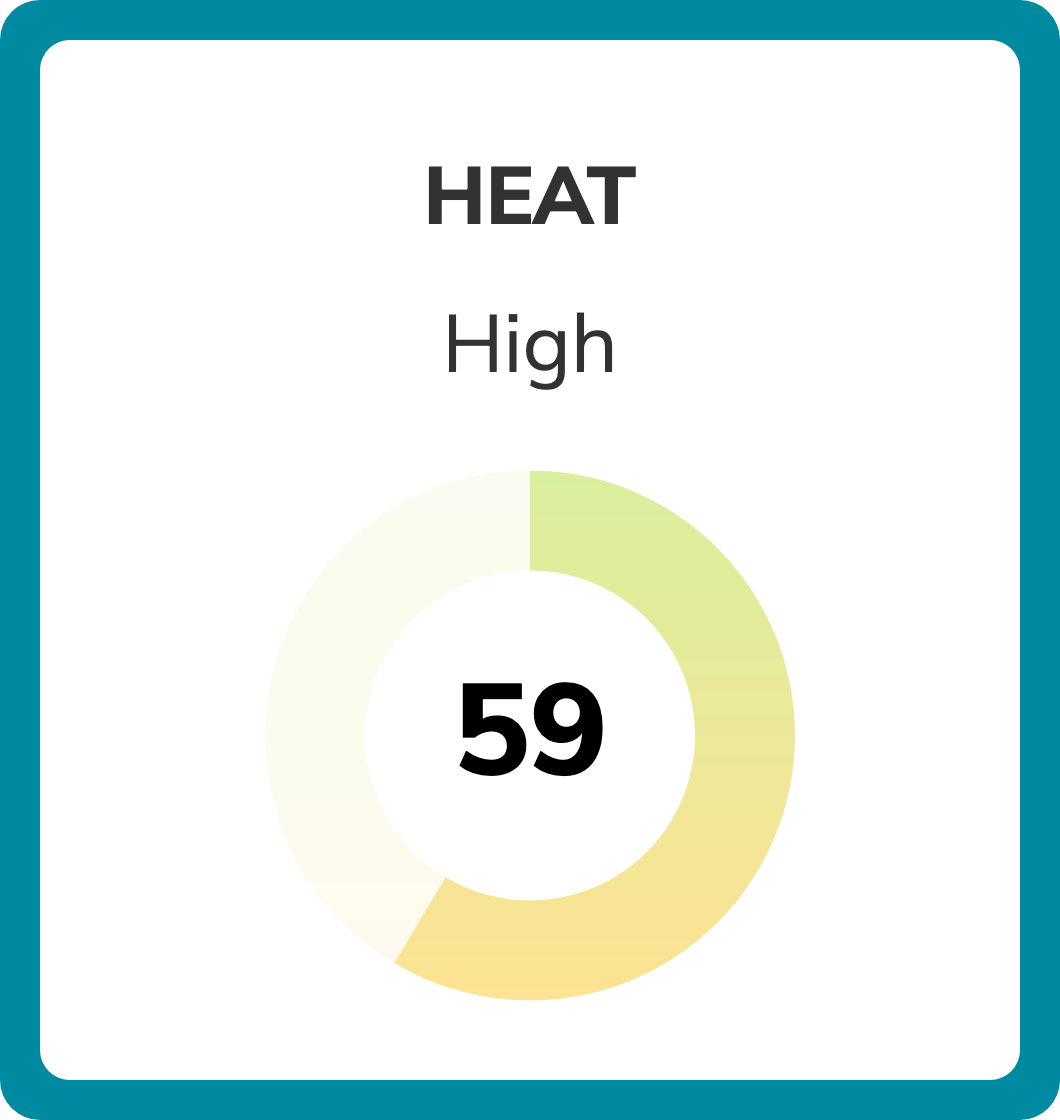
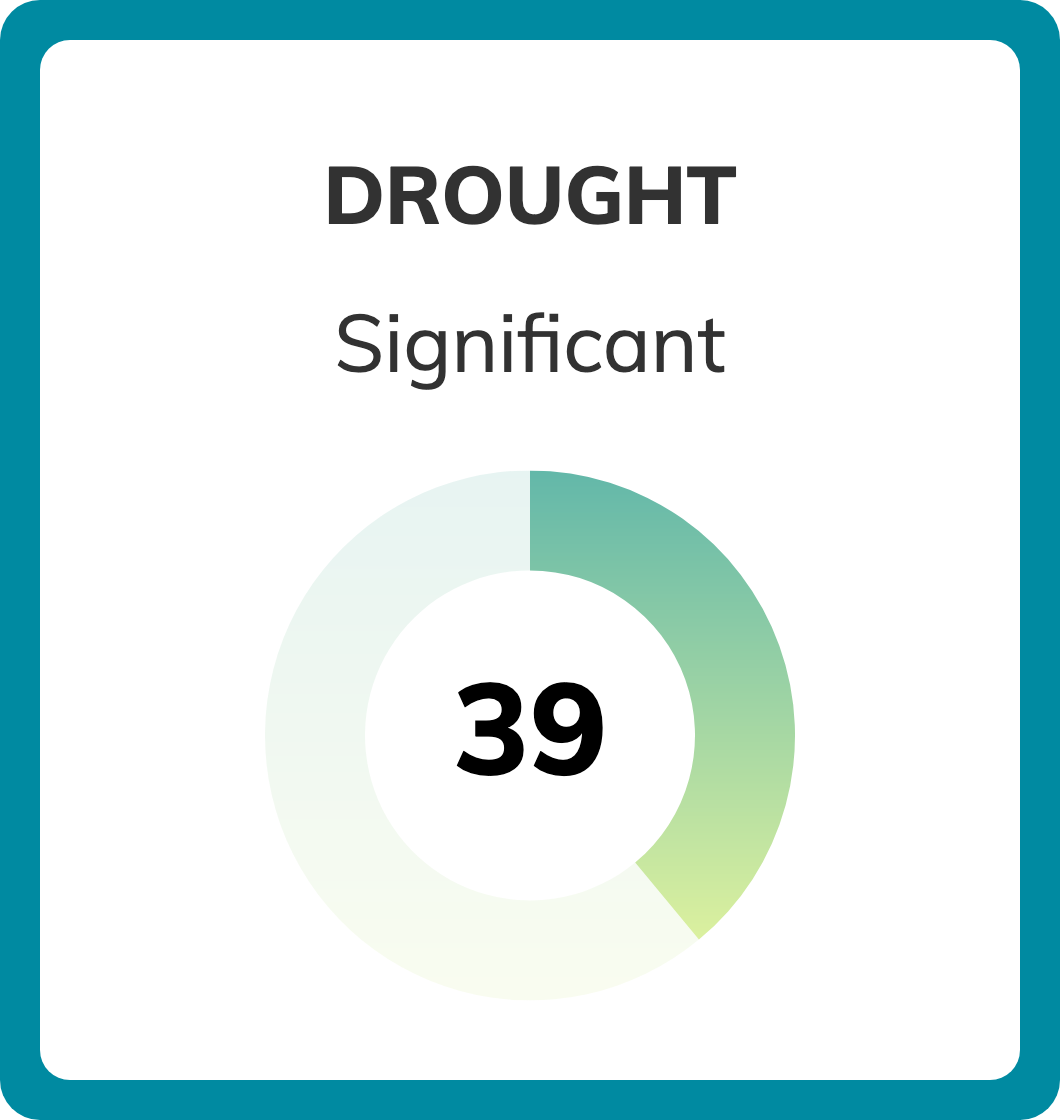
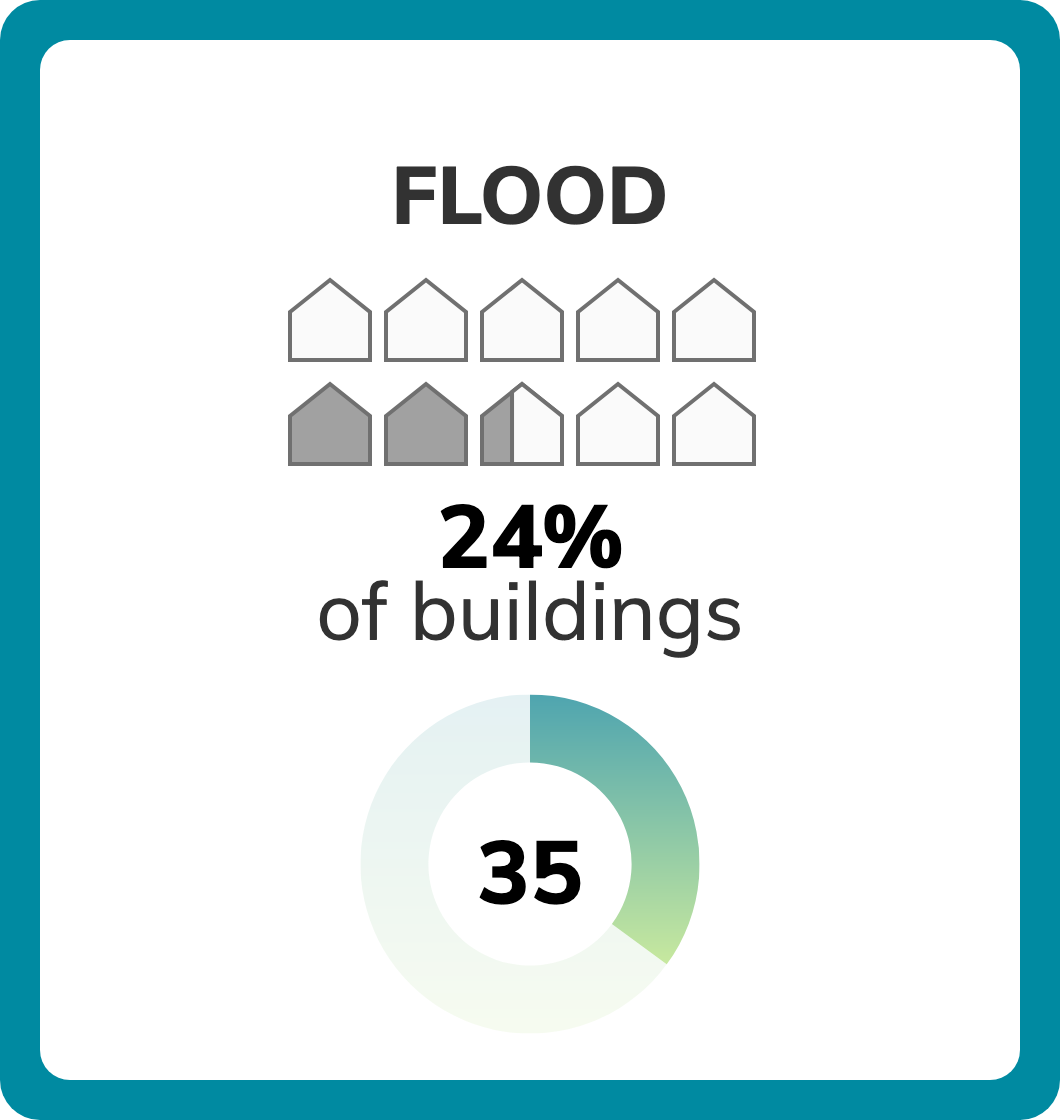
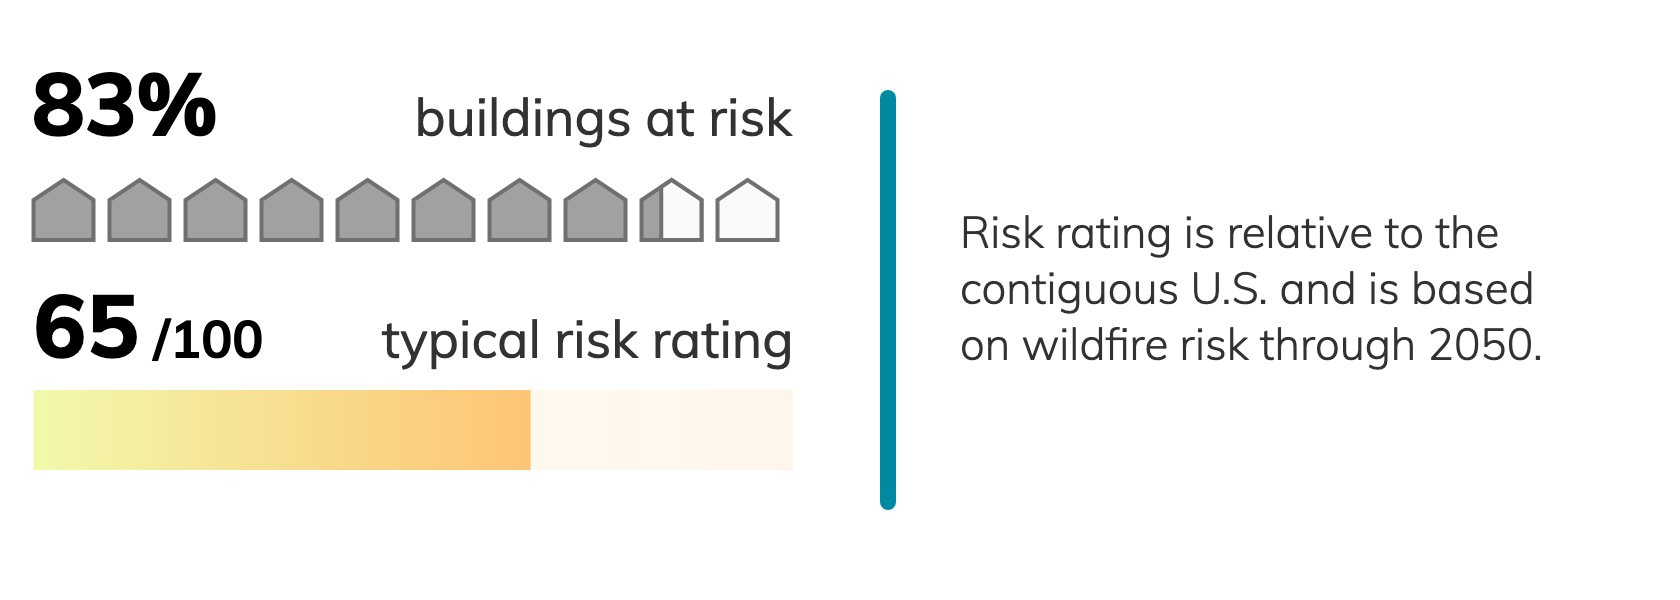
Heat risk in Corona, CA is high. Drought risk is significant. Precipitation risk is relatively low. About 83% of buildings in Corona, CA are at risk of wildfire, and the risk level for these buildings is very high. About 24% of buildings in Corona, CA are at risk of flooding, and the risk level for these buildings is significant.

Fire risk in Corona, CA
The risk on the most dangerous fire weather days in Corona is extreme. The number of these days per year is expected to increase through 2050.

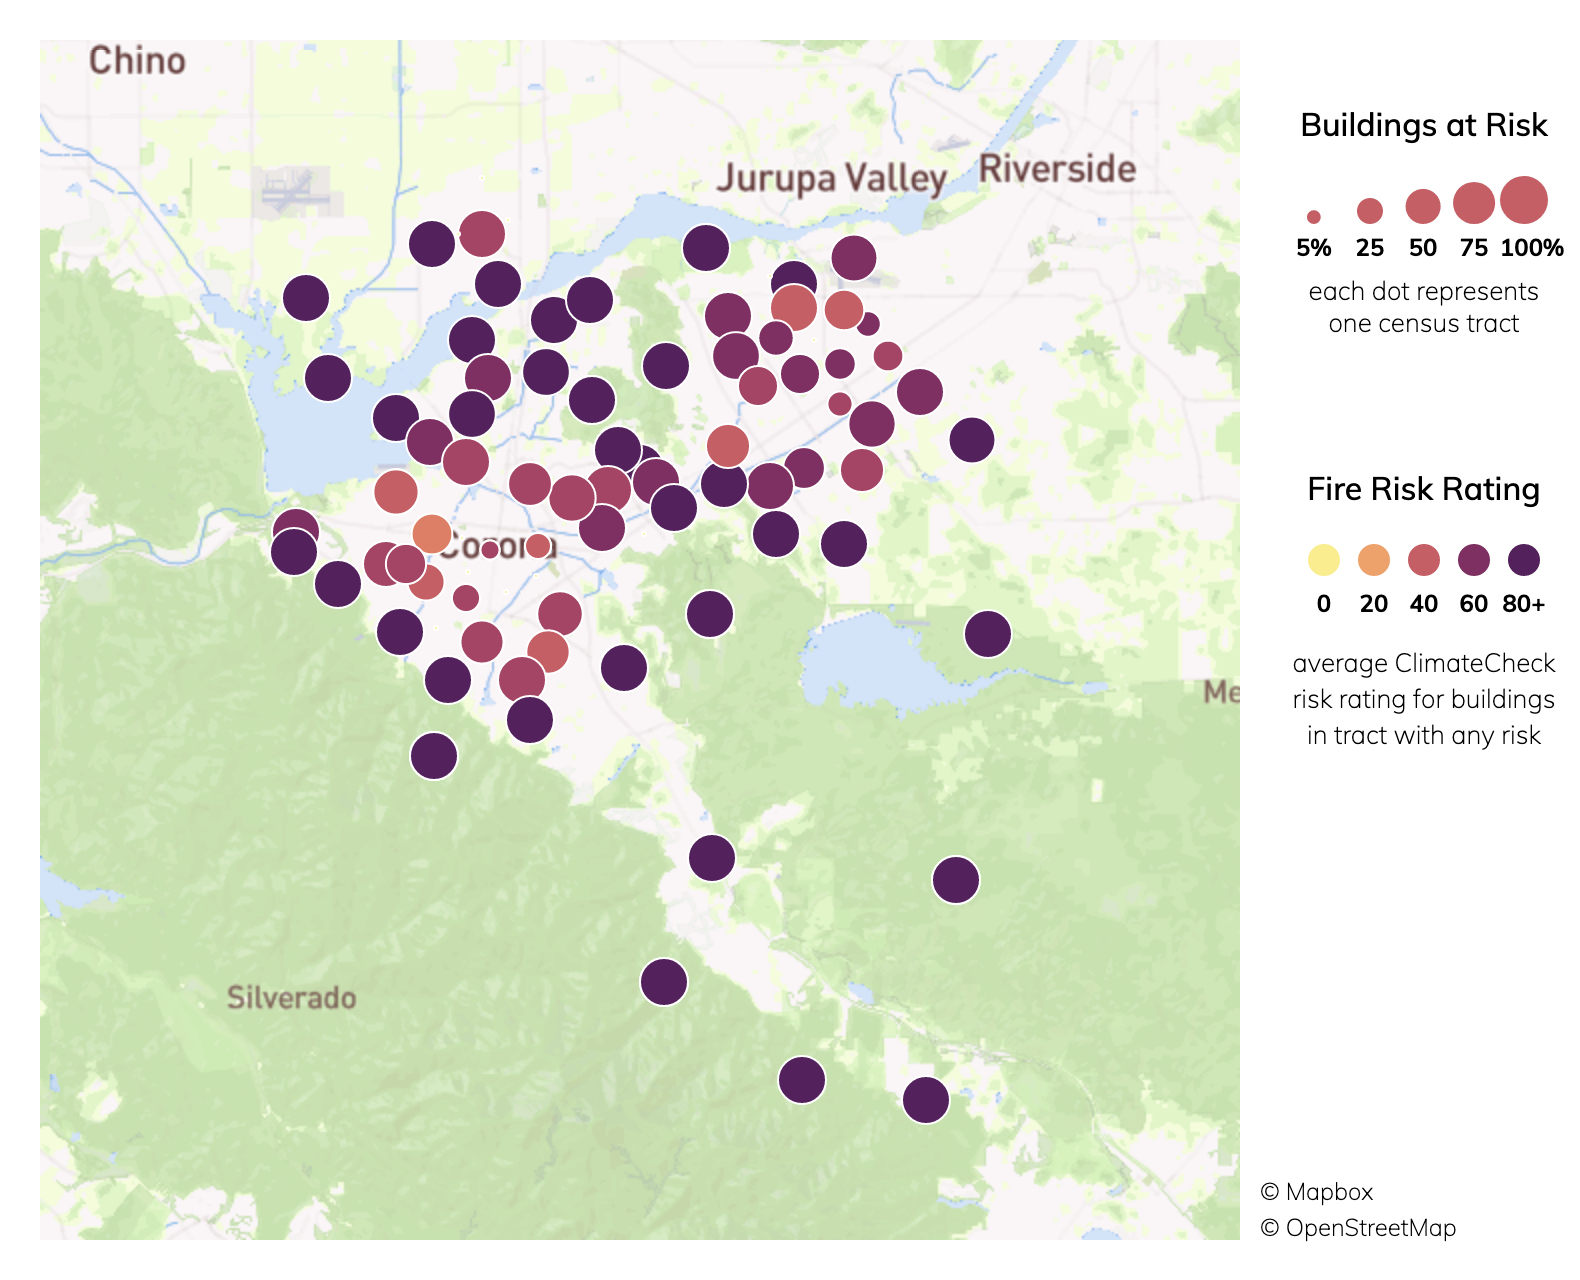
Of 106 census tracts in Corona, CA, there are 91 where more than a quarter of buildings have significant fire risk, and 86 where more than half of buildings have significant fire risk. Property owners can take steps to mitigate their risks from wildfires.

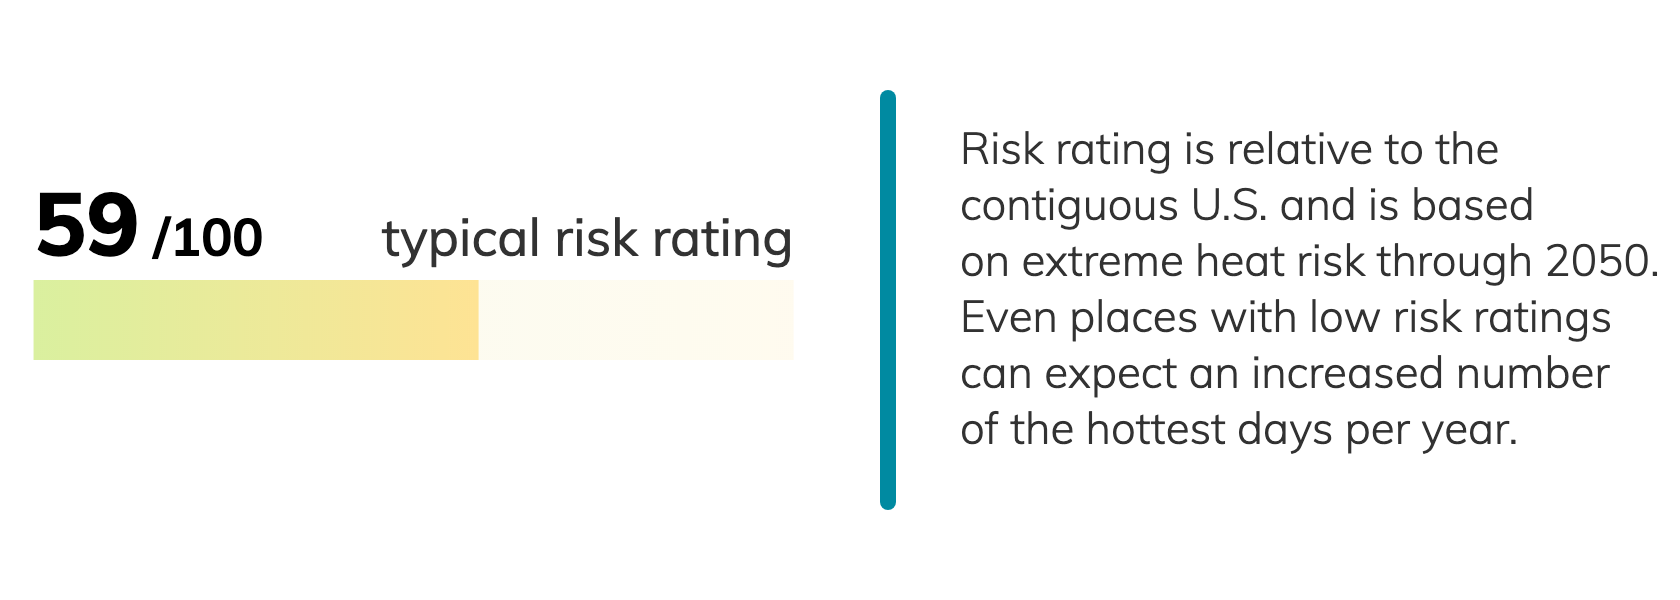
Heat risk in Corona, CA
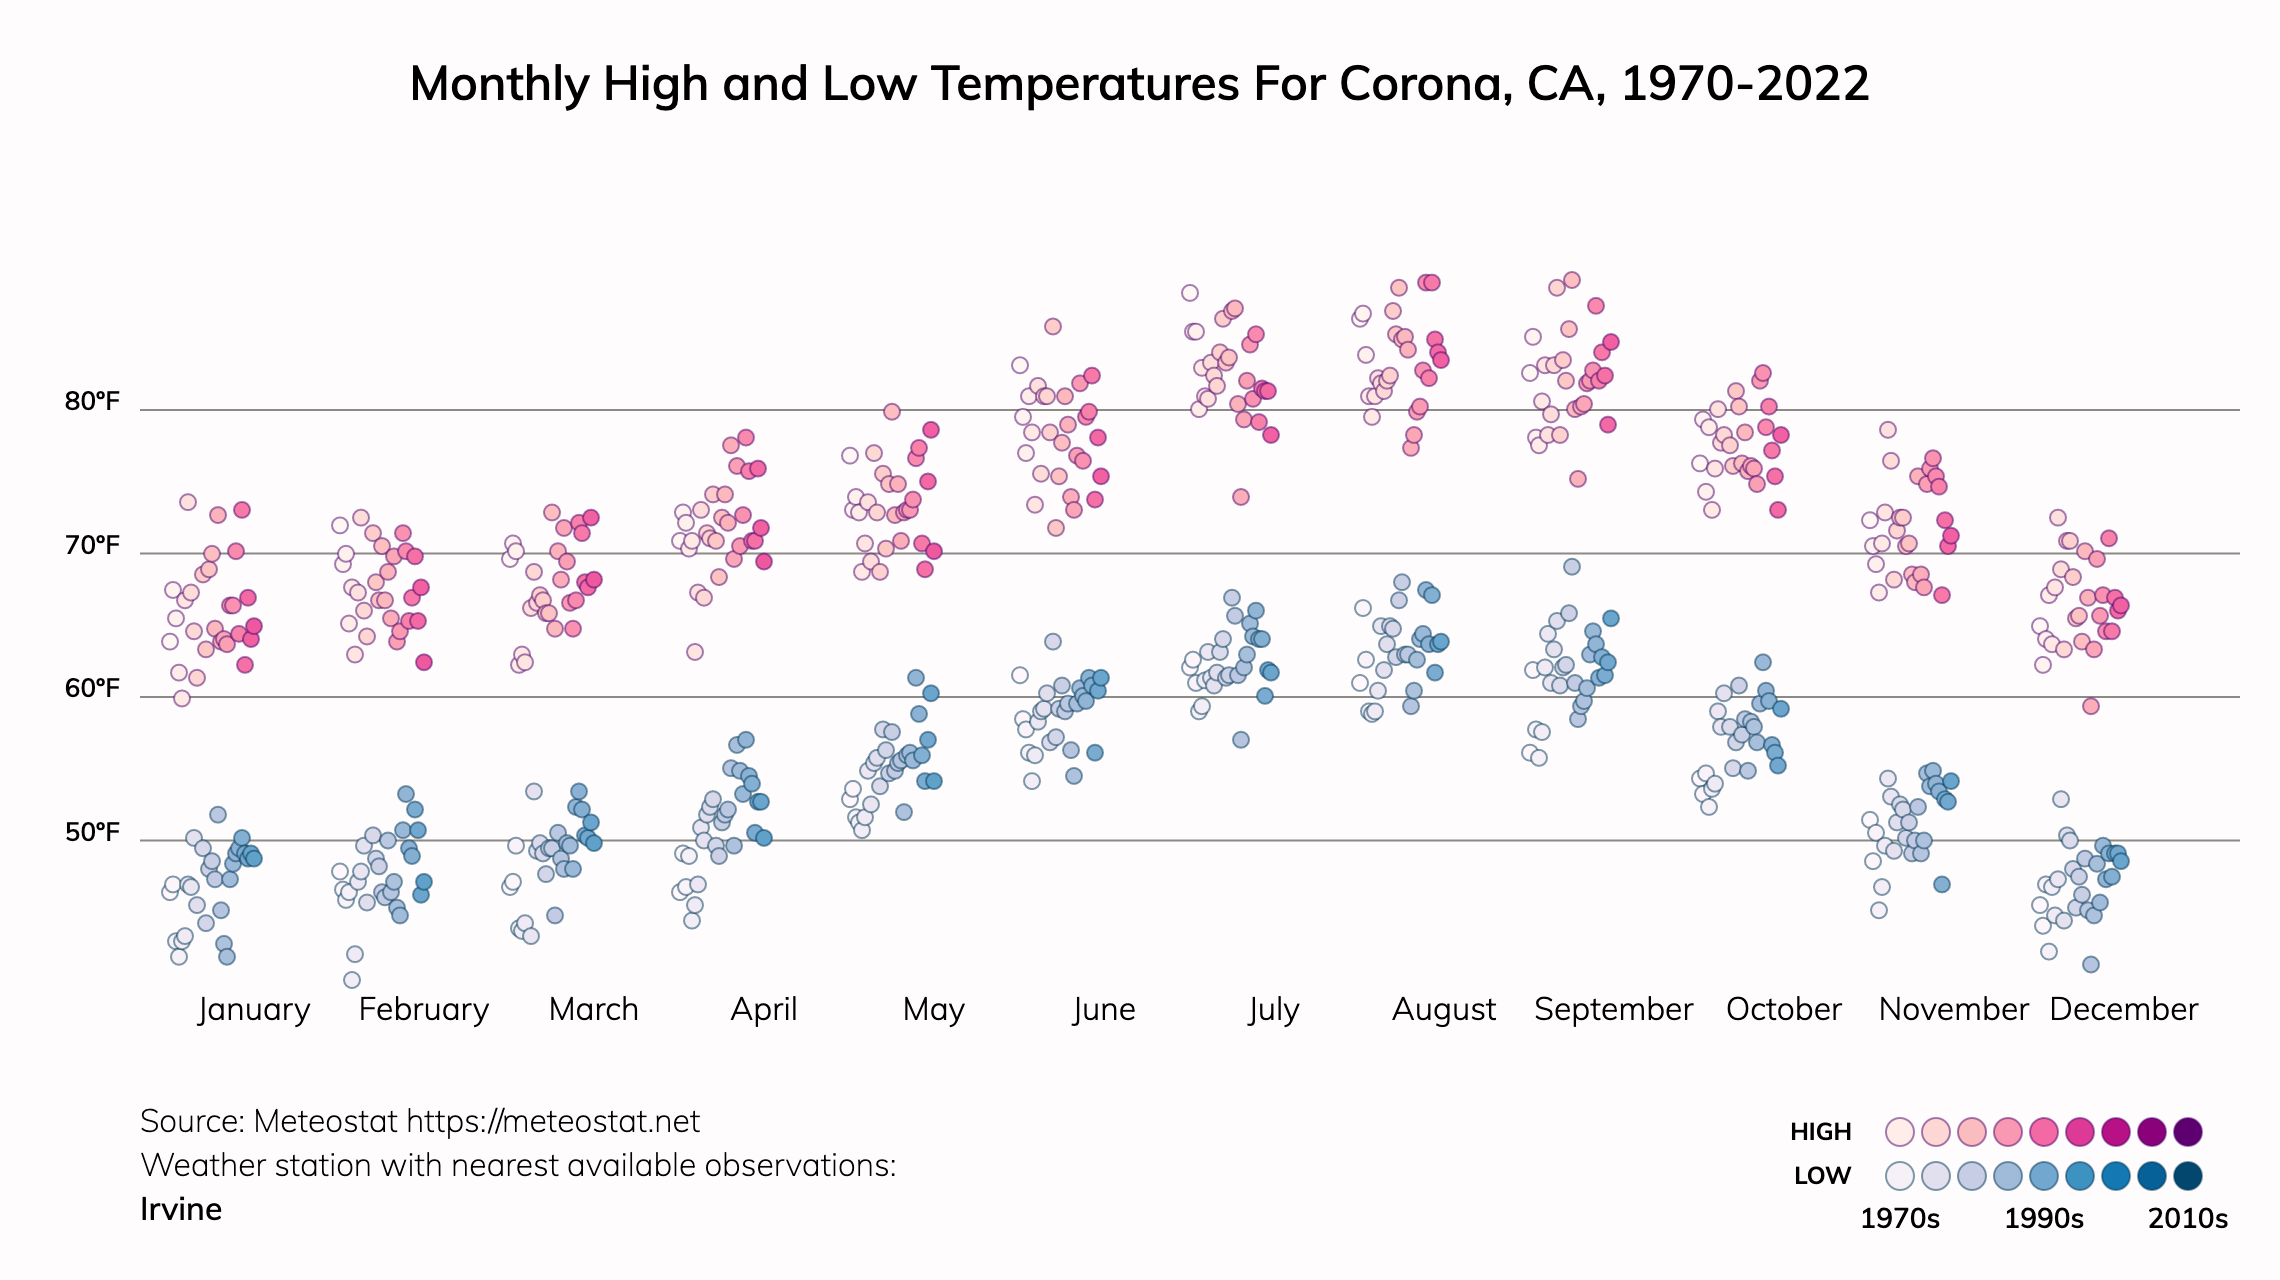
The number of the hottest days in Corona is projected to keep increasing.
In a typical year around 1990, people in Corona, CA experienced about 7 days above 100.2ºF in a year. By 2050, people in Corona are projected to experience an average of about 32 days per year over 100.2ºF.

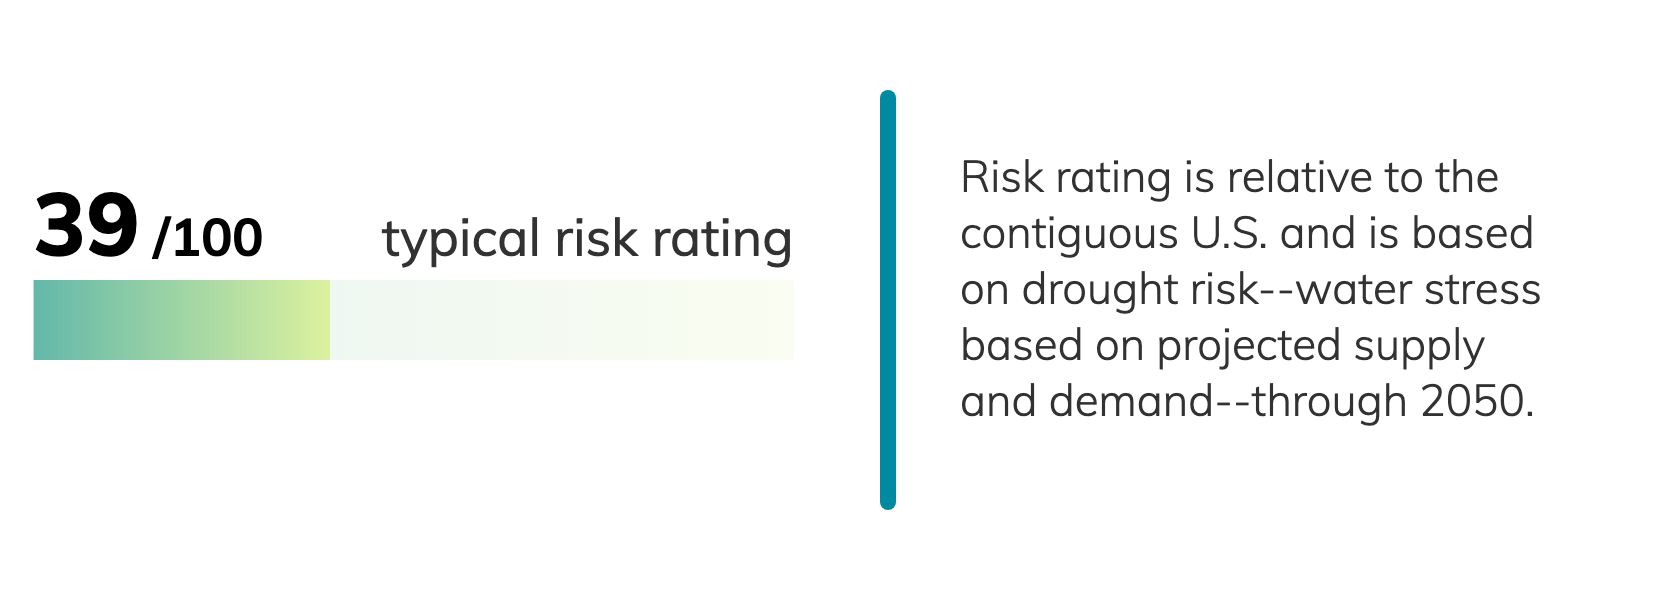
Drought risk in Corona, CA
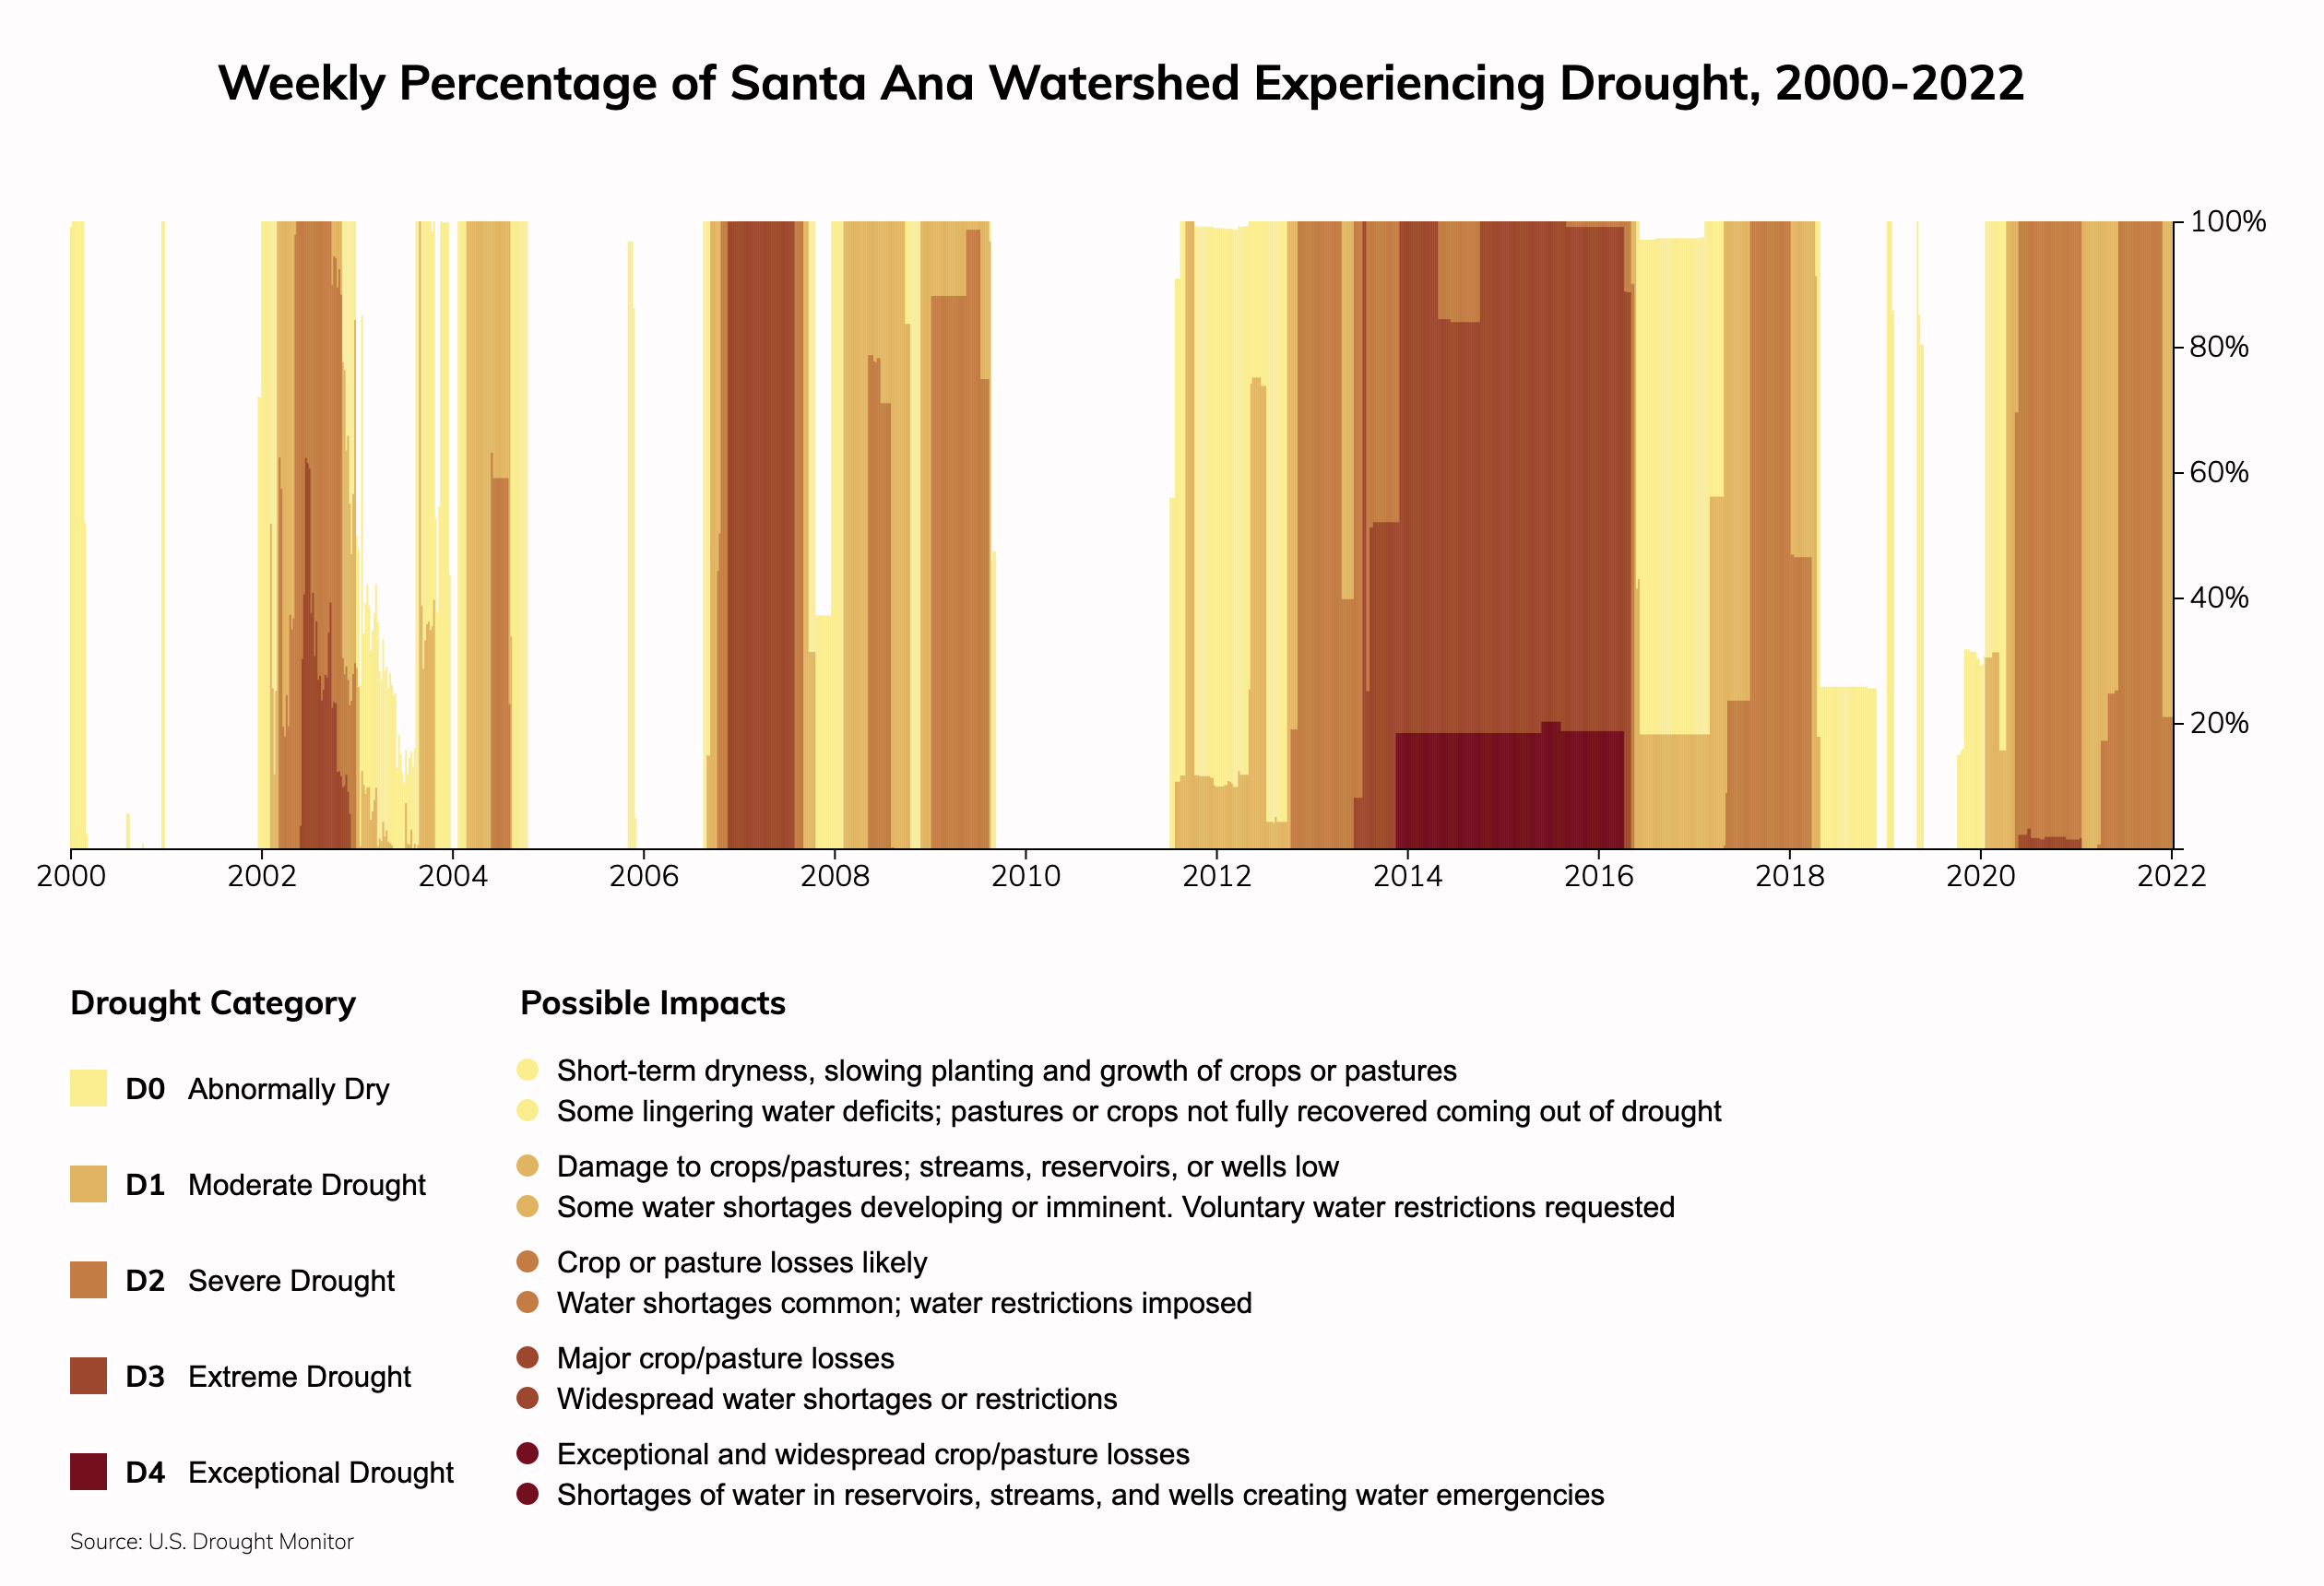
The average water stress in Corona is projected to be higher around 2050 than around 2015.
The Santa Ana watershed, which contains Corona, CA, has experienced 872 weeks (73% of weeks) since 2000 with some of its area in drought of any level, and 261 weeks (22% of weeks) since 2000 with some of its area in Extreme or Exceptional drought. Source: National Drought Monitor.

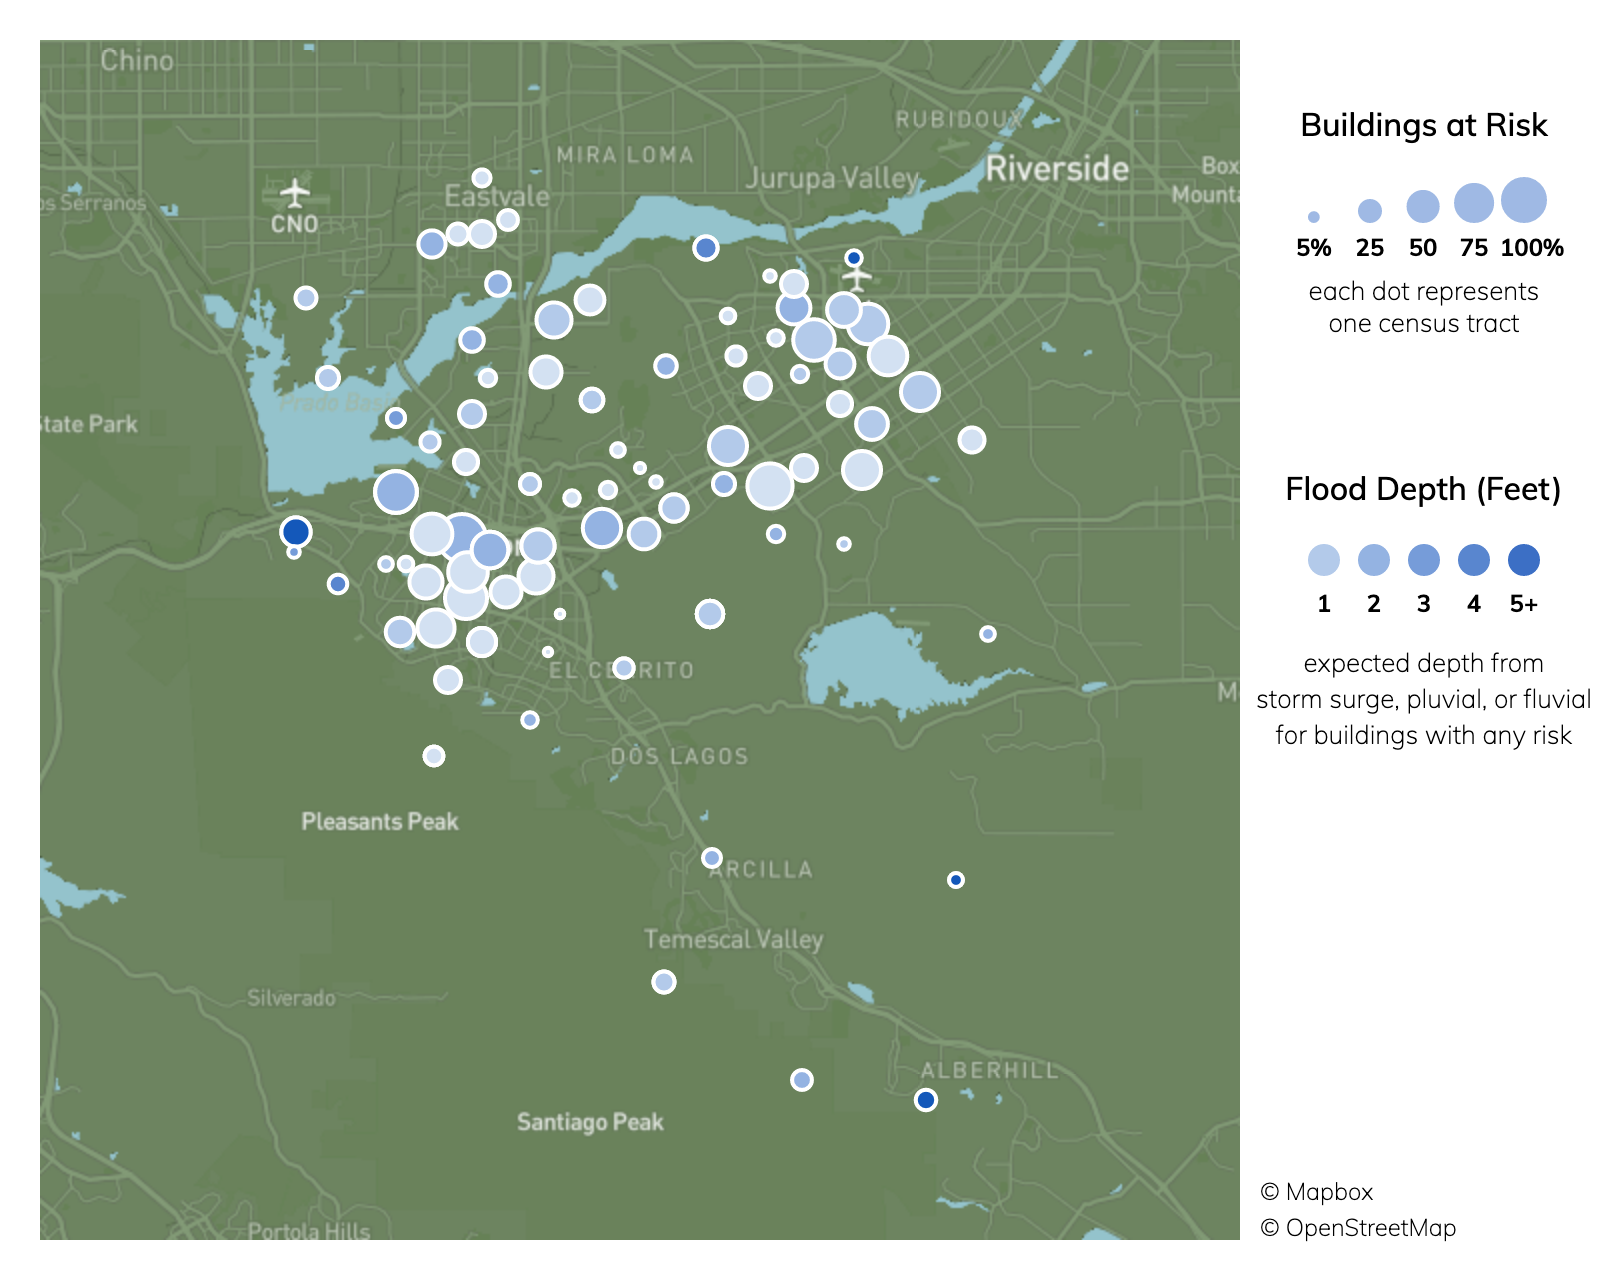
Flood risk in Corona, CA
Buildings at risk in Corona average about a 30% chance of a flood about 1.3 feet deep over 30 years.
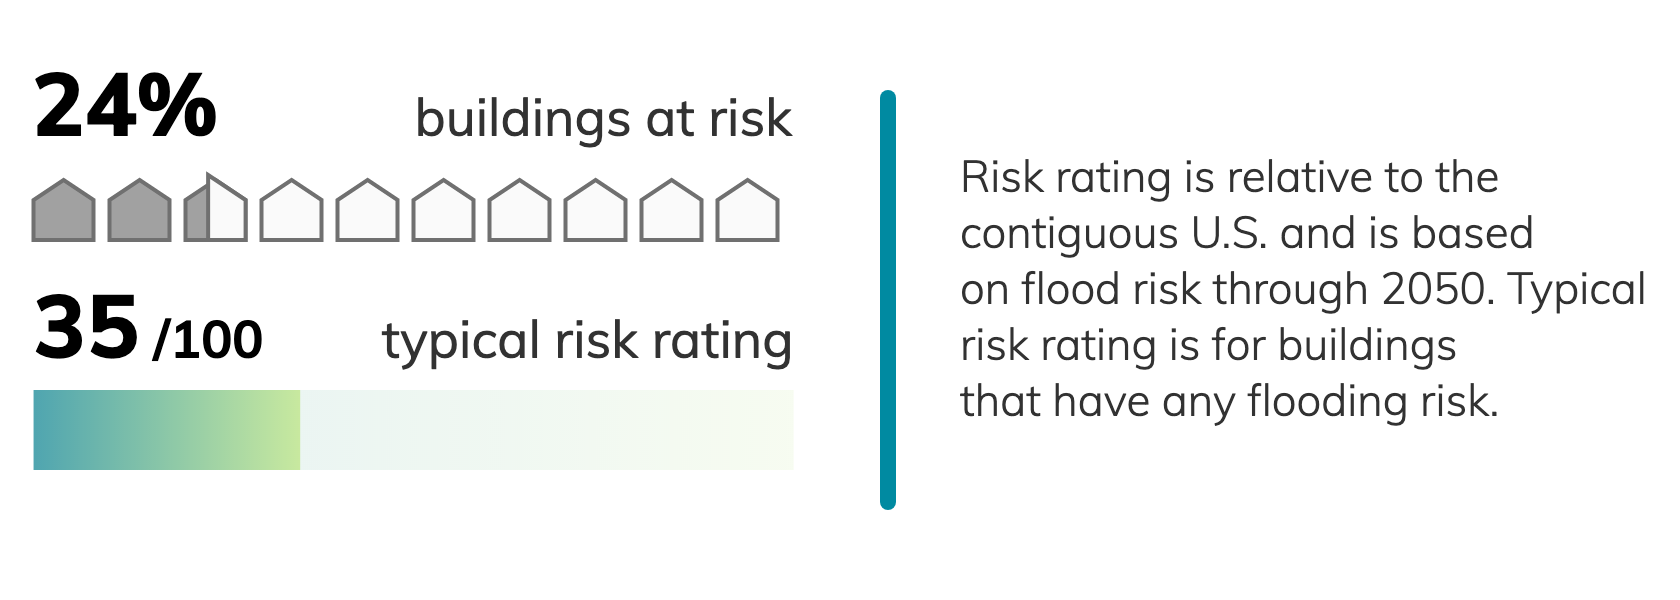
Of 106 census tracts in Corona, CA, there are 20 where more than half of buildings have significant risk from surface (pluvial) flooding and riverine (fluvial) flooding. Property owners can check a specific address for flood risk including FEMA flood zone, then take steps to reduce their vulnerability to flooding damage.

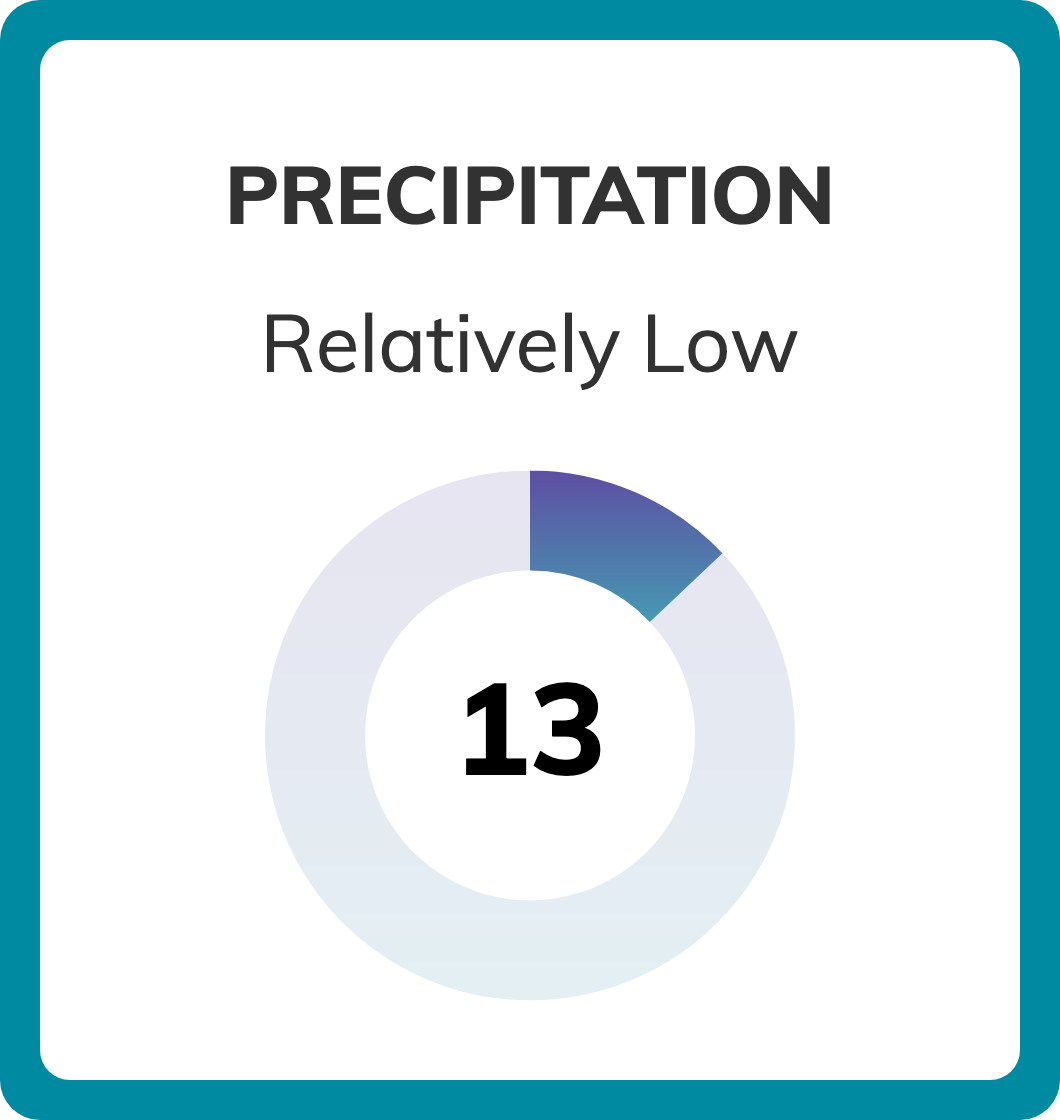
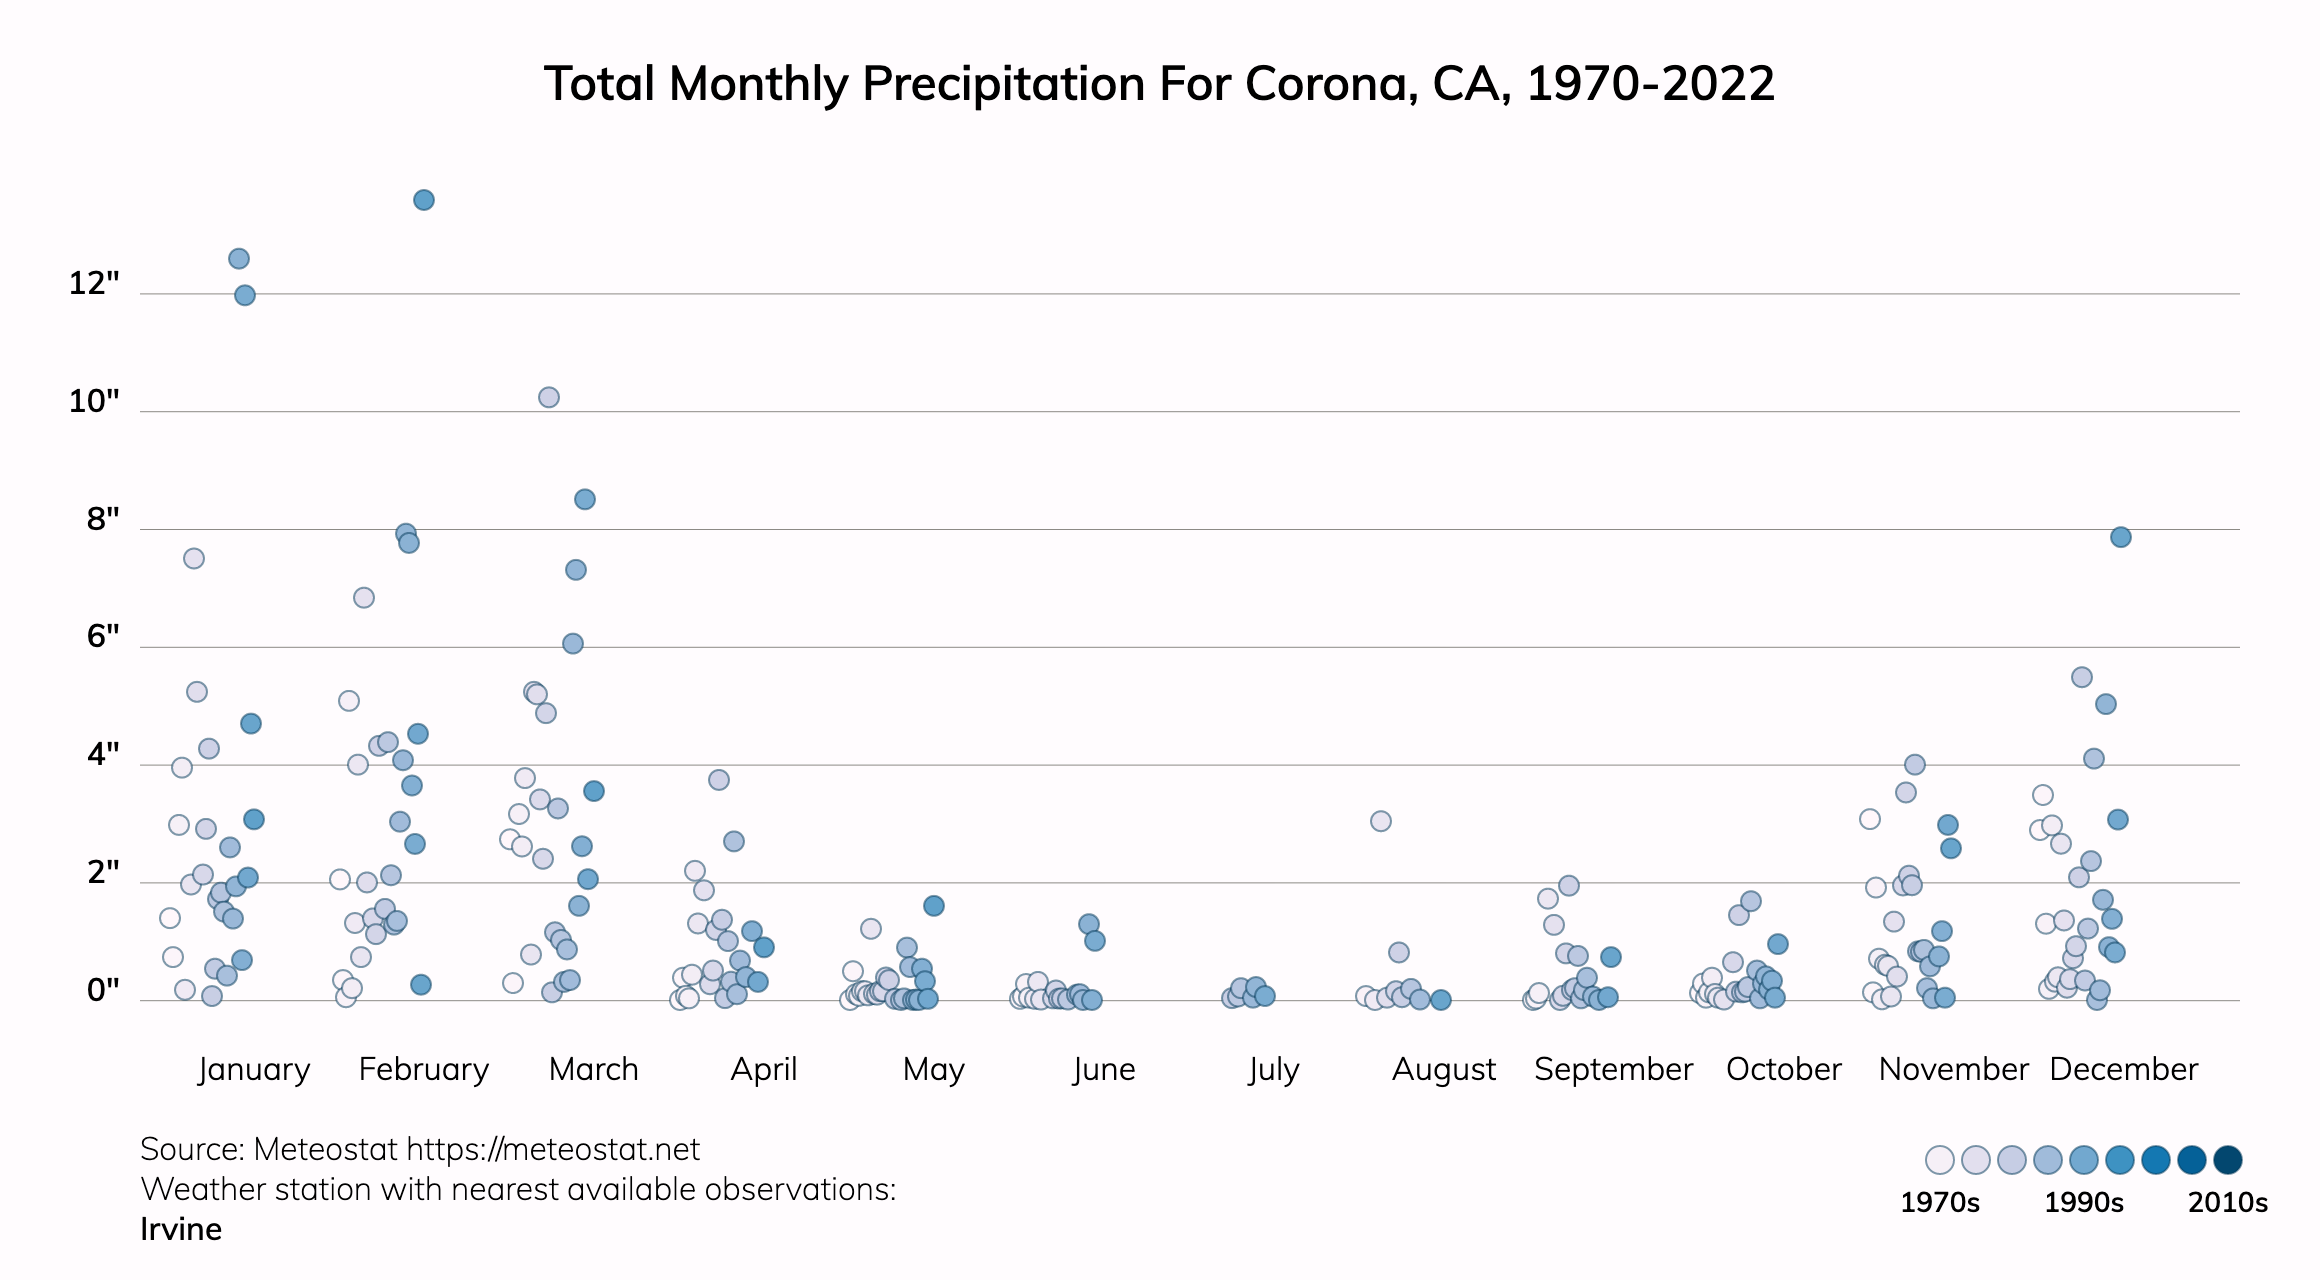
Precipitation risk in Corona, CA
The share of precipitation during the biggest downpours in Corona is projected to increase.
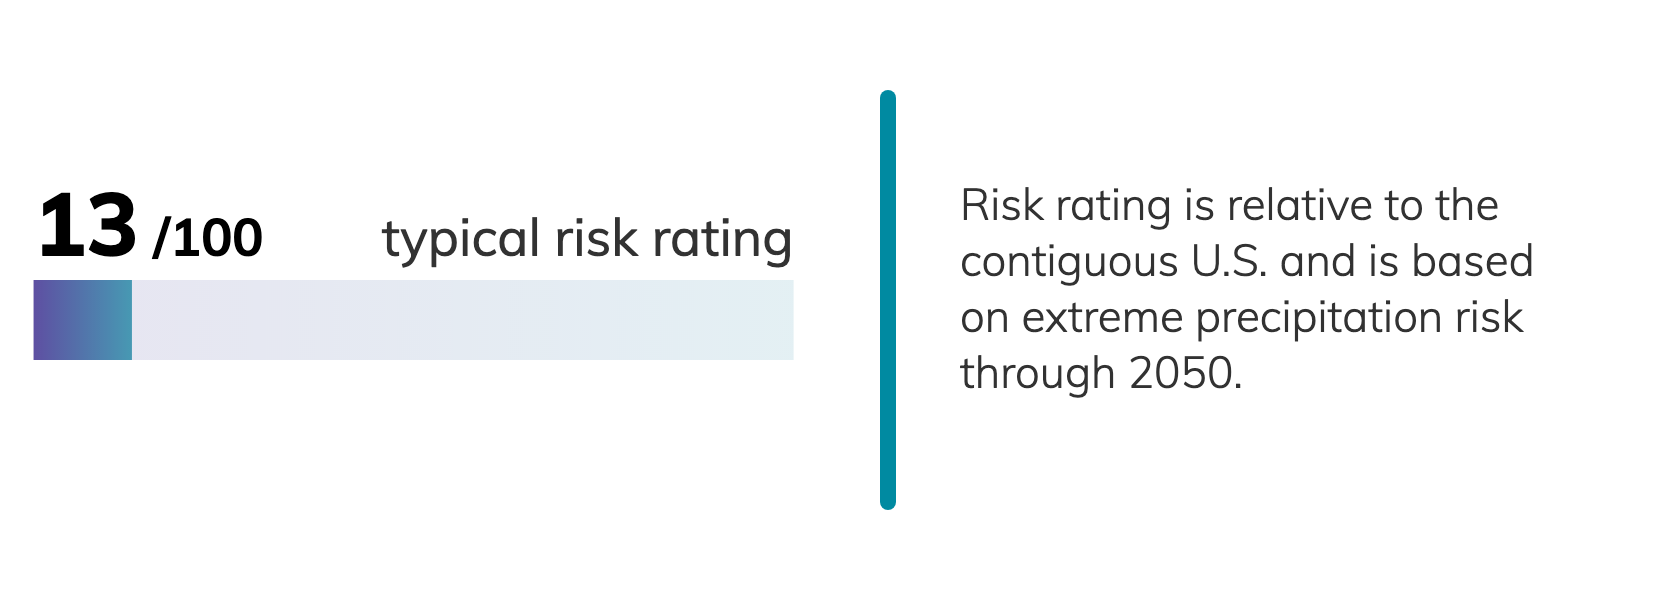
A downpour for Corona, CA is a two-day rainfall total over 0.4 inches. Around 1990, about 68.0% of precipitation fell during these downpours. In 2050, this is projected to be about 71.0%. The annual precipitation in Corona, CA is projected to remain about 11.3".

How can we limit climate change and live in a transforming world?
The projections on this page describe a future that we still have a chance to avoid. To keep average global warming below 1.5ºC—the goal agreed on in the 2015 Paris Climate Accords—we need to act rapidly to drastically reduce greenhouse gas emissions.
Understand Risks
The risks presented on this page reflect modeled averages for Corona, CA under one projected emissions scenario and can vary for individual properties. To find out more, check a specific address and request a report describing risks to your property and in your area.
Reduce Emissions
The latest Intergovernmental Panel on Climate Change report states: “If global emissions continue at current rates, the remaining carbon budget for keeping warming to 1.5ºC will likely be exhausted before 2030.” This remaining carbon budget is about the same amount as total global emissions 2010-2019.
Protect Homes and Communities
Check our free report for tips on protecting your home from hazards.